RE of LR3
Synopsis
As a cat loving hacker, when I found out that I wasn’t the only one at elttam with an automated cat litter device, I began to wonder what interesting things I may find when doing a small tear down of the Litter Robot’s components including the PCB, firmware, and mobile application. Since I come from a web security background, this research would be an opportunity to learn new topics - and I hope by writing about my approach it helps others in a similar situation. So, please follow me on my journey to understanding the extraction and analysis of an ESP32 IOT device, reverse engineering a Flutter mobile application, and capturing and analysing the network traffic between the device, the mobile app and the internet.
Note: This work was done a while ago, and focussed on the Litter Robot 3. The manufacturer has since come out with the Litter Robot 4 - which presumably has new software, features, and possibly hardware configuration.
Hardware
I began by pulling out the main board from the device and looking for interesting tells of which chip is in use, the wireless technology in use, whether there may be existing ports/outputs that could give clues into debugging the device.
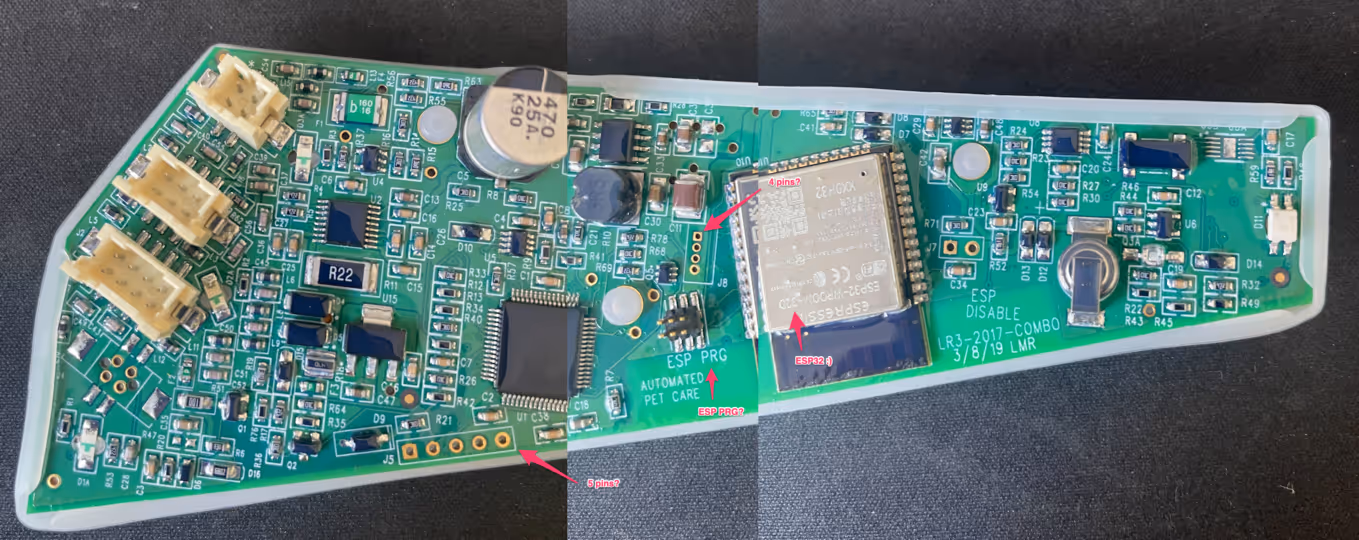
Initial visual inspection reveals the following:
- There is an ESP32-WROOM-32D chip.
- There are 5 unused pinouts near the bottom of the board.
- There is an
ESP PRG6 pinout as well. - To the left of the chip we can see another unused 4 pinout.
- Lastly… the board is completely coated in some kind of resin.
My initial assumption was that there would be a few paths I could take:
- Maybe I can work out the UART interface and see some log messages.
ESP PRGsounds like some kind of programming interface, maybe there is a way to communicate there.- Pull off the shield on the chip and maybe just dump the memory directly.Lucky for you, I tried all of the above, I’ll save you time as well to note that none of the free pin-outs available except for the
ESP PRGprovided an obvious communication interface to the device (I’m probably wrong here too).
ESP PRG - UART
After failing to determine any potential UART interfaces on the free pinouts, I turned to the 6 pin ESP PRG pins. Looking online it appears that Expressif supplies a programming board called the ESP-Prog which can be used to communicate with the ESP32. The ESP-Prog supports a standard programming output as well as a JTAG interface.
I called up Dan, who you may remember from ESP-IDF SETUP GUIDE, who happened to have an ESP-Prog board handy and within a day I had one in my hands. I also followed similar steps to set up the ESP-IDF toolkit.
I plugged the supplied cable from the 6 pin ESP PRG interface on the device to my new ESP-Prog board and then connected the board to my computer via USB. Using the ESP-IDF kit, I ran the following command:
Aaaaand… I got nothing. Great. What did I do wrong?It turns out that the 6 pin ESP PRG interface does not actually line up to the dev board I have and I’ll need to find the true pinout structure. This is also something I probably should have checked with my trusty multimeter as I did with the rest of the pinouts, but here we are.
Finding the ESP-Prog interface
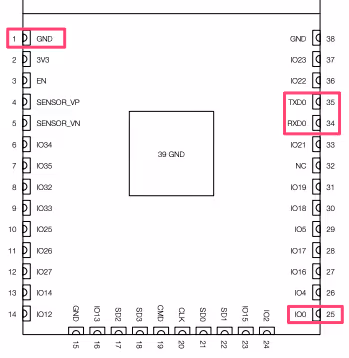
I figured there must be some dedicated pinouts from the chip itself for the programming interface, so I grabbed the datasheet for the ESP32-WROOM-32D from the Expressif site and began to map out the pins required.
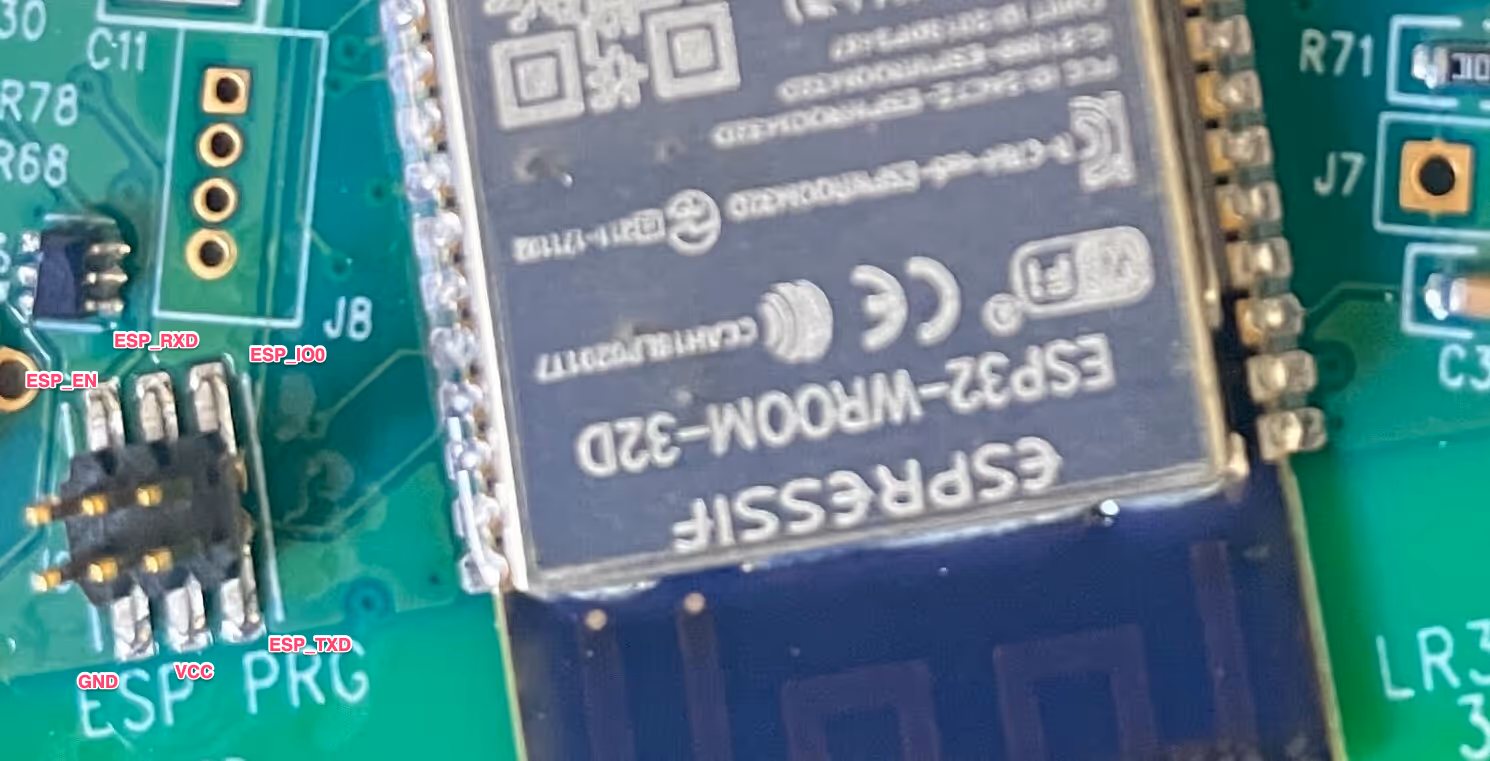
First of all, the ESP-Prog board has the following structure:
3.3vGNDESP_IO0ESP_ENESP_TXDESP_RXD
The necessary pins are:
- GND
- ESP_IO0
- ESP_TXD
- ESP_RXD
Going back to the datasheet, we can see that the required pins match to the following chip pin positions:
- GND - 1
- ESP_IO0 - 25
- ESP_TXD - 34
- ESP_RXD - 35
I then took out my multimeter in continuity mode and placed one prong on the chip pin and one on the ESP PRG pin to identify the corresponding outputs, mind you I had to scrape the resin that was covering the connectors on the chip and you don’t want to see how that turned out.
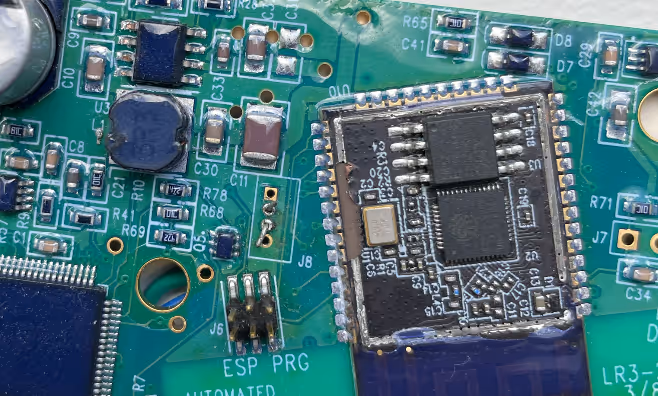
Spoiler warning: How I left the chip looking...This also gives you an idea of the resin that was coating the board, I looked into solvents but didn't have much time to go and experiment with them in the end.
I then soldered some wires from the underside to keep it neat, or maybe to hide the mess, and ran the pins to the programmer board.
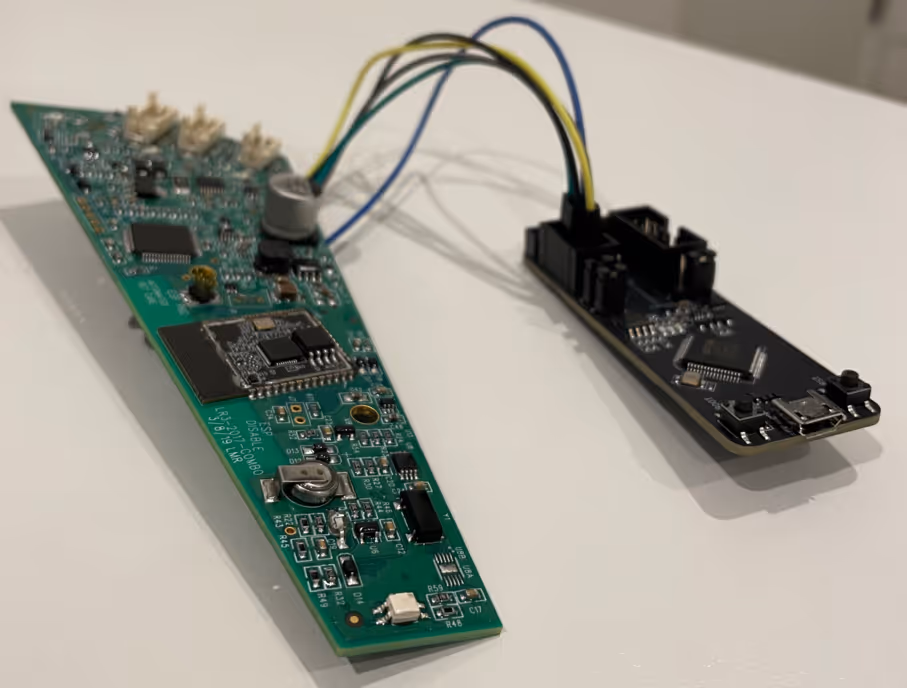
With my fancy new pinouts now connected to the ESP programmer board and then to the computer, I gave the command another whirl.
And……
Boom! We have some debug messages coming through the serial port. Now we can keep track of any interesting things being logged in real time. I was also able to get more info from the board using esptool.py and espfuse.py.
It’s probably worth noting that it would/should be possible to dump the firmware using esptool.py at this point, however I decided to try out more gadgets first.
Just dump the flash
Usually I would start with the mobile application and see if there is some kind of firmware updater/downloader in order to get my hands on something to play with, but I decided to go with a static approach first and to try some gadgets that my colleagues sent me to play with. In this case I had my hands on a Dediprog SF100 which is a serial flash programmer, I was told I can just hook these up to the on-board flash chip and dump the contents. So let’s try that.
Step 1: Expose the chip (remove the shield).
Step 2: Attach the clips from the SF100 to the flash pins.
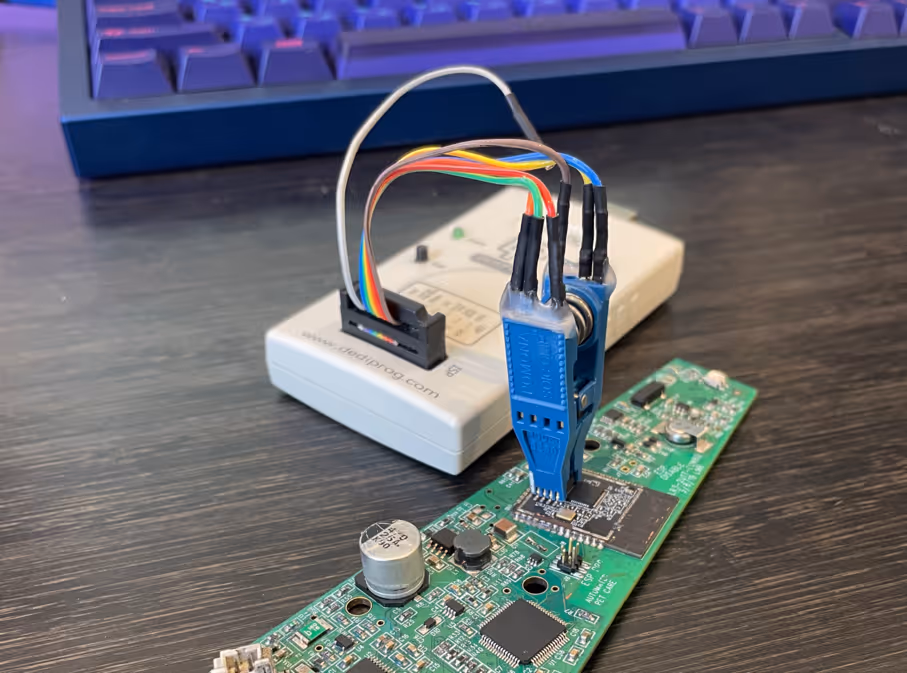
Step 3: Connect via USB and open the DediProg Engineer application.
Here I selected XMC25QH32C as it was the text I could read on the flash chip, might take a bit of squinting to read.
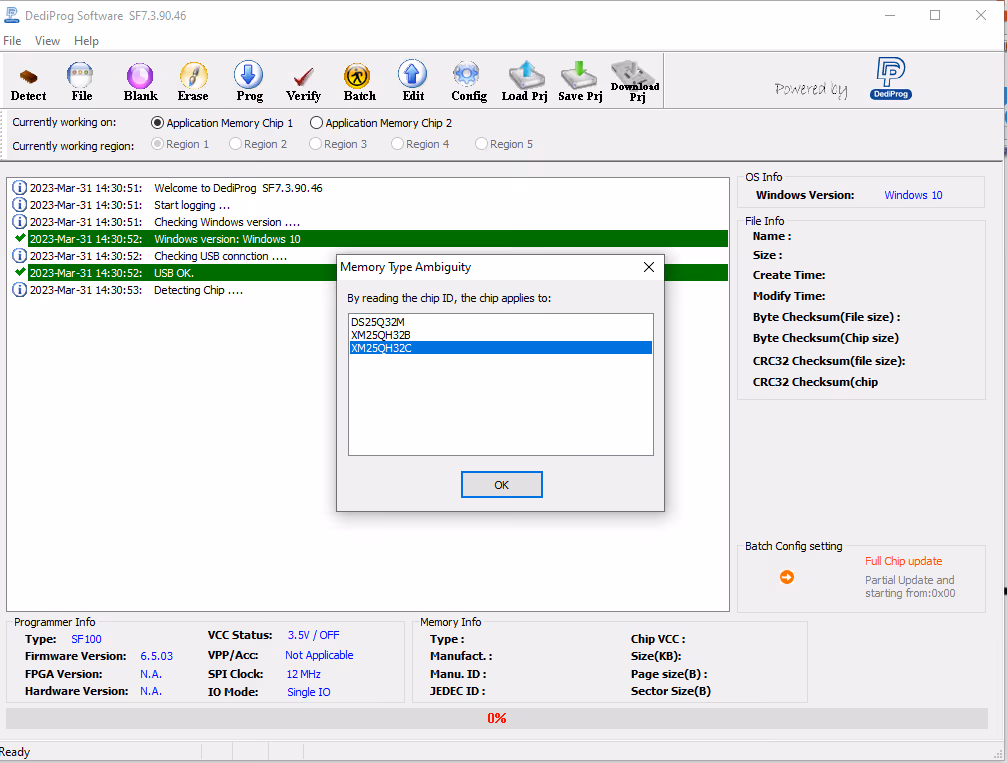
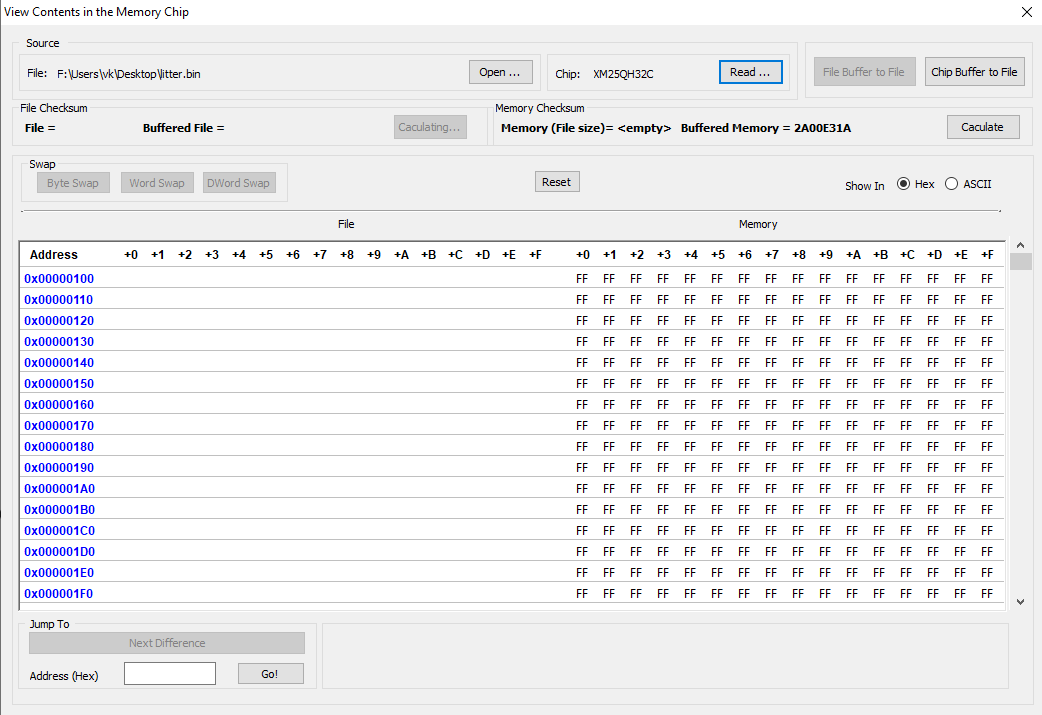
Step 4: Select Edit and Read to extract the contents of the chip.
Selecting Chip buffer to file will allow you to then save the .bin file of the flash memory.
Firmware Extraction
So we’ve got the extracted memory dump, but we need to make sense of the dump. Initially I thought I’d hit it with binwalk to see what would show up, the output was interesting but wasn’t quite what I was looking for.
You can see the full results here
So a quick google on ESP32 dump parsing lead me to the esp32_image_parser.py tool. Using the parser, we are able to view and extract the partition tables from the binary we extracted. The show_partitions argument revealed the following partitions:
There’s a lot to digest here, during the project I determined that:
ota_0was the main application firmware that I was interested in looking at.ota_1appeared to be some kind of bootloader/updater.- The
picprefixed sections corresponded to the extra controllers and sensors connected to the device. - Various configurations were stored in the
nvsandconfigsections, however they did not seem to have anything user controlled at the time.
I then attempted to use the create_elf argument to extract only the ota_0 binary but I ran into this error:
A quick Google identified another researcher who had run into the same error. The fix made a small change to esp32_image_parser.py.
I was then able to extract the primary device firmware binary,
Bonus
I was also able to perform a similar extraction using the espressif/esp-idf tools after a little bit of tweaking to the extracted flash dump. Initially when running the gen_esp32part.py tool I was running into errors, however after a quick read through of the Espressif Partition Tables documentation, we can see that the partition table is located at 0x8000 in the flash.
We can then use dd to strip the first 32768 (0x8000) bytes and verify the partition table using gen_esp32part.py:
Firmware Reverse Engineering
The first thing to note is that the ESP32 firmware instructions were in the Xtensa architecture format. At the time of research, the plugins for various disassemblers was quite limited. So naturally I used them all, at the same time, side by side.
A few notes before I continue:
- The
Ghidraplugin that I used can be located here Ebiroll/ghidra-xtensa. - The
Binary Ninjaplugin that I used is here zackorndorff/binja-xtensa. - I found
cutter(cutter.re) to naturally have a pretty good view of the firmware without plugins. - I attempted to use the anszom/Hopper-cpu-Xtensa plugin for
Hopper Disassemblerhowever it didn’t play too nice.
My goal was to basically identify how the device handles on-boarding, communication with the API and network traffic.
A quick first pass of the identified strings in Ghidra revealed usage of the AWS iOT SDK:
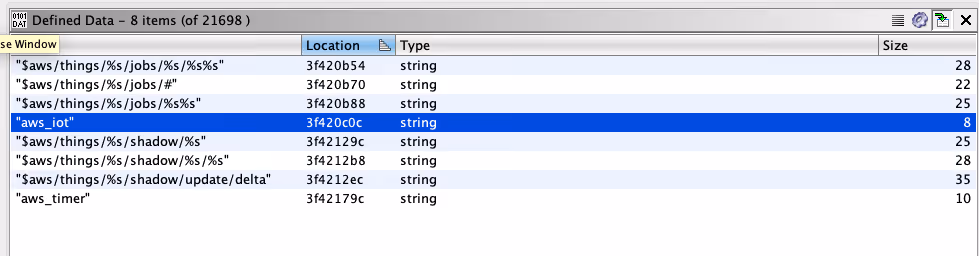
This was important as it indicates that the device will be enrolled and communicate with the AWS IoT core cloud service, a further look into this can be seen further down in the mobile application review.
Another interesting string identified suggested some form of configuration (which I’ll go into a bit further down too):
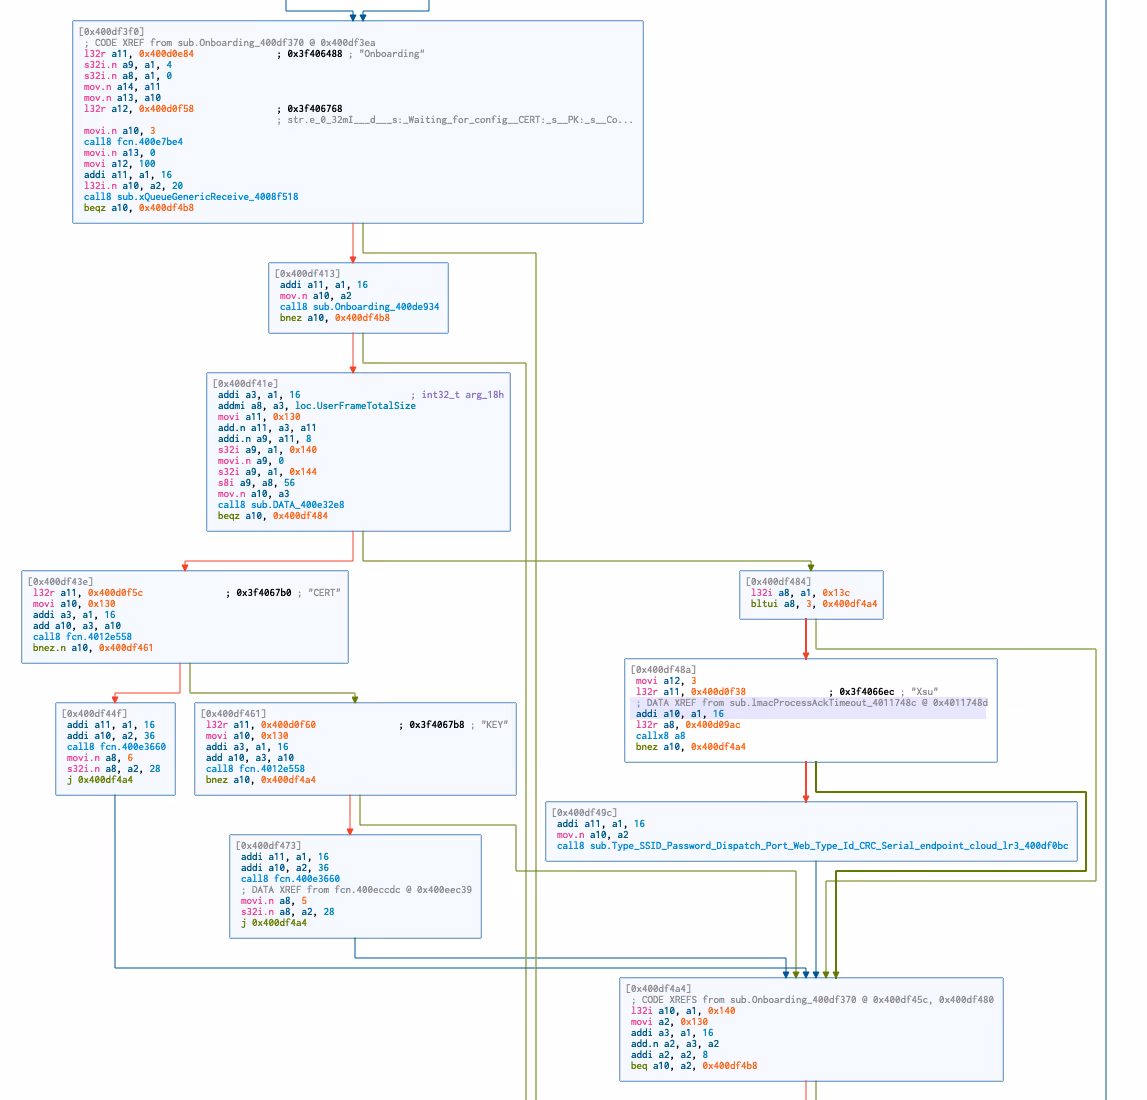
In cutter I was able to see that this string was being used in the Onboarding methods.
I was also able to visualise several sections of the on-boarding flow such as the following, where we can now see that each element of the on-boarding configuration is checked.
Lastly, I was interested in the communication protocol between the Mobile Application, AWS IoT Instance and the device itself. Trawling through Github I found various projects where researchers had translated the MQTT messages. One project in particular was mbafford/litter-robot-to-mqtt, the researcher mbafford has created a MITM proxy to intercept and view the outgoing and incoming messages to the device, however explains that the device will not accept incoming messages without a valid checksum attached. I was hoping to identify the code responsible for the checksum, however I wasn’t successful during this stint.
The other thing worth mentioning here is that the time of mbafford, it appears that the Litter Robot was using a self hosted MQTT broker. The change to the AWS IoT framework meant that the communication to the server was now encrypted via TLS and I was no longer able to intercept the traffic without replacing the server certificates on the device.
It was clear that the dispatch commands were handled by the firmware:
Cleaning up the disassembly
For clean-up I began by attempting to map the sections and segments first. I found that some of the scripts within Ghidra mentioned loading of ‘SVD’ files, so a quick google resulted in the ehntoo/binaryninja-svd plugin. However when I attempted to load the ESP32 SVD files I found here, I kept getting crashes and issues within Binary Ninja and the plugin itself.
As it turns out, the ESP32 SVD appears to have multiple addressBlock entries per peripheral, this was mentioned in an older issue. I managed to fix up this plugin (PR14) using an updated SVD parser script at stm32-rs/svdtools.
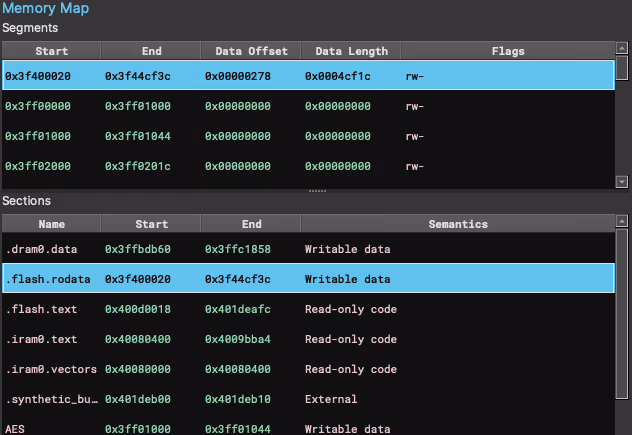
This allowed me to have the correct segments and sections mapped within Binary Ninja, a quick ‘reanalysis’ and things became a little clearer.
The next step was to better define some of the functions, now this was tricky because Binary Ninja seems to do funky stuff when it comes to defining functions, you can’t actually define the start and end… I did two things here, first of all I found this article by apriorit which mentions the entry a1, xx instruction, they said:
This instruction translates into byte sequences such as 36 41 00 / 36 61 00 / 36 81 00 depending on the value of the XX argument.
So I tested out some theories using the binaryview API and came up with the following dirty snippets:
I repeated this for the other sequences which led to around ~7,000 functions being defined. The other thing I noticed was that Cutter had actually defined a lot more functions that appeared to be pretty accurate, so naturally I dumped that list of addresses too and ran it through the function above too.
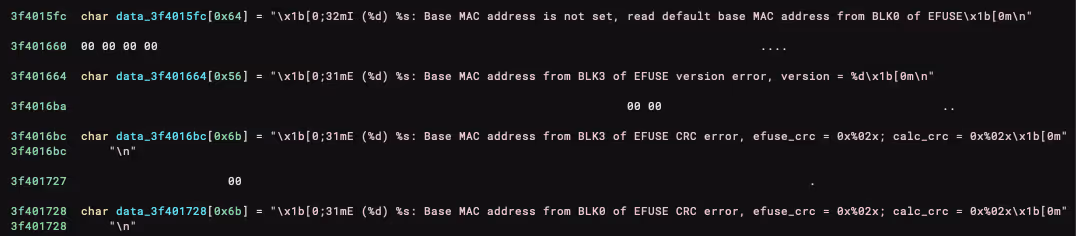
Strings were next, there were a couple of clear patterns that were a bit unusual in the firmware, one of those being the logger strings starting with \x1b. Binary Ninja didn’t really like this, so once again, small little snippet to define those structures too.
Resulting in:
It was also possible to define a lot of the JSON strings with the pattern \x00\x7b\x22, there’s a bit too much to show there though.
Before I could continue, I also noticed some very strange behaviour in the Binary Ninja Xtensa Plugin. For example, you can see in this image that some addresses appeared to be mapped twice and the RETW and RETW.N instructions were not being handled correctly:
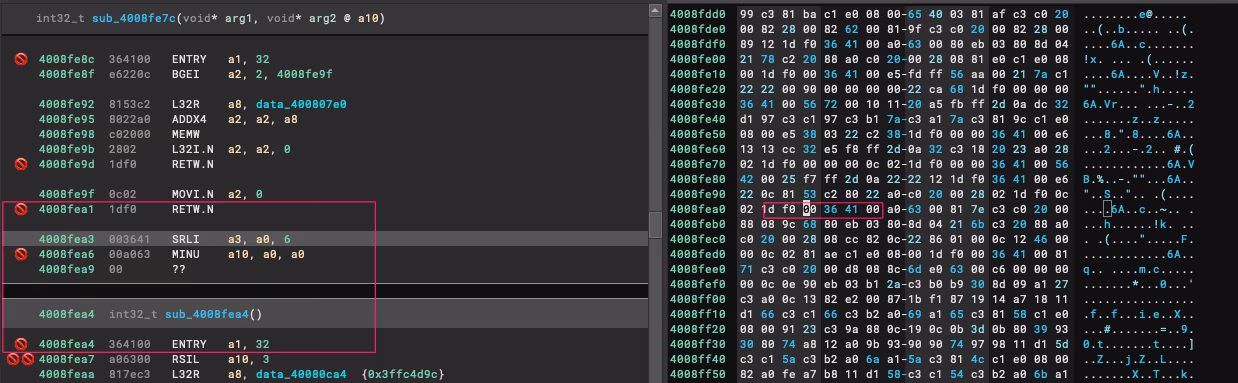
I had to make a couple of changes to the plugin (PR2) to clean this up, resulting in the correct end/start of functions (mostly).
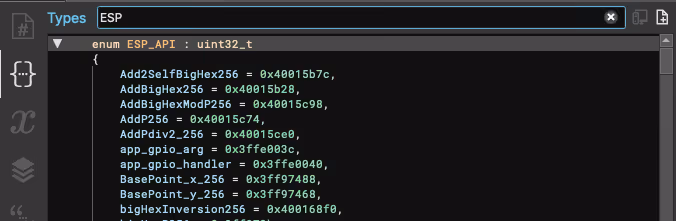
The last little trick I found (and I’m sure there is probably a better way to implement this), as mentioned in the apriorit article above, there are also calls to low-level API functions in the IROM part of the CPU. As it’s been explained well in the article, I won’t go into too much detail, however a quick trick to have some visibility within Binary Ninja is to:
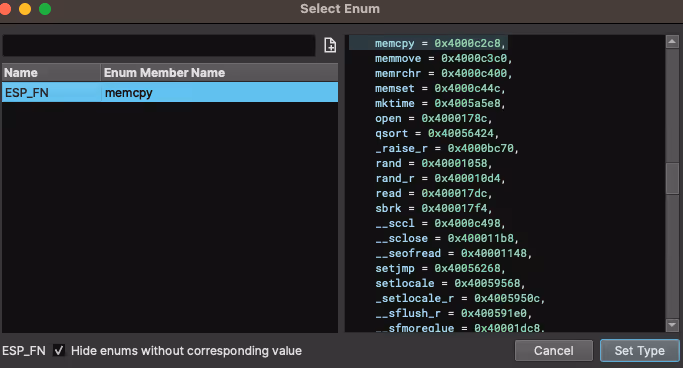
- Grab the various
ESP32 ROM address tablefiles from espressif/esp-idf. - Convert them into
enumformat. - Head to the ‘Types’ tab in Binary Ninja, right click and select
Create new types.... - Paste your
enuminto the text area and hitCreate.
You should have something similar to this:
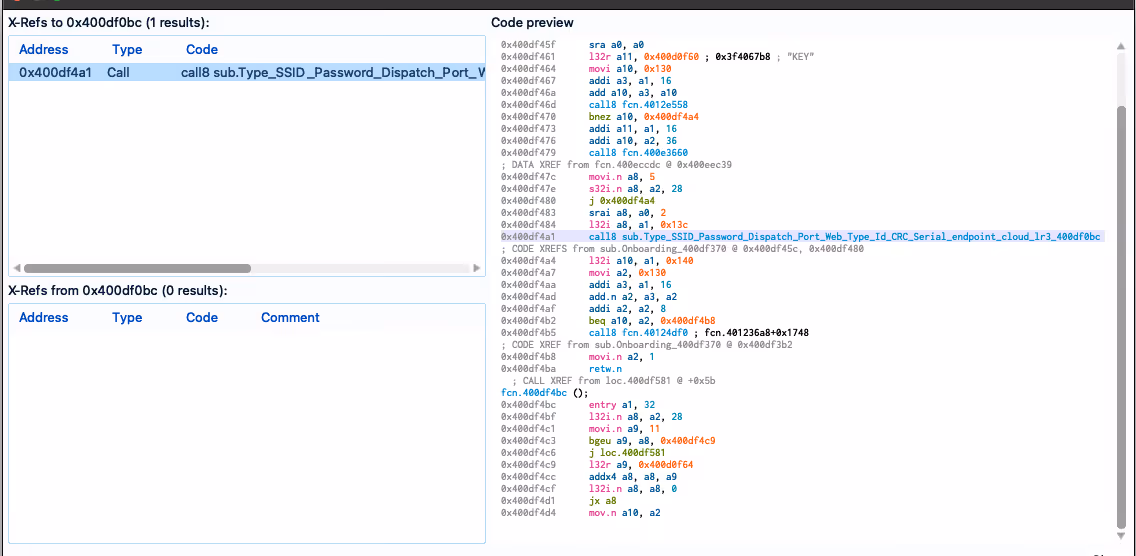
Now when you located an instruction calling a function outside of the range such as these:
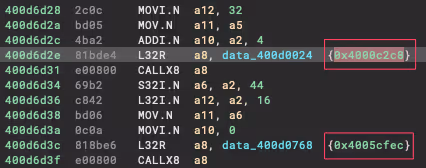
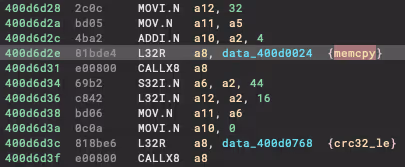
You are able to select the address, hit the M key and choose the matched API value:
And your assembly view should now look like this (I believe this code handles the CRC checks within the config partition of the flash dump):
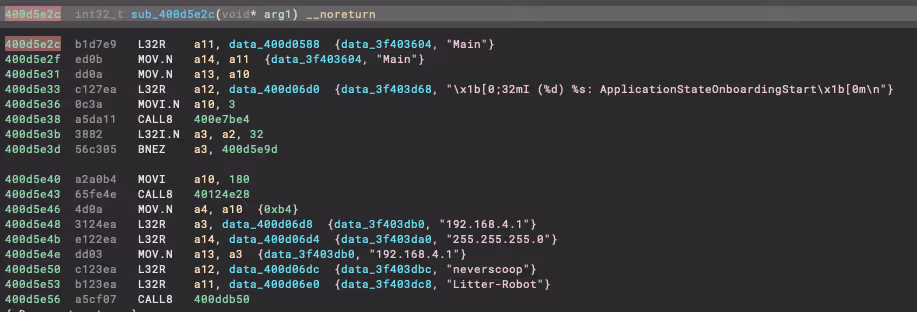
Pretty cool, I know… anyway, unfortunately I haven’t got much more to show you on the reversing side, I hope some of this proves to be useful for those of you that have made it this far. Ultimately it allowed me to have areas of code that were quite readable, such as the on-boarding configuration routine you can see here:
Packet Sniffing and Config
What I wanted to do was capture the traffic that was sent from my phone to the device during on-boarding. To understand how the device is configured, but also to hopefully open up new avenues to configure and flash the device. For example, can we integrate the device completely offline and have it configured without using the application? Or, perhaps we can flash the firmware without connecting to the hardware?Both of these questions, will be partly answered here, and I hope this article opens up further exploration to achieve these goals.
The first step was achieving a reliable way to capture the traffic between the two devices. Understanding the flow during the configuration phase was important, it goes like this (roughly):
- Creates a wireless network called
litter-robotwith the passwordneverscoop. - The user connects their phone to the
litter-robotnetwork and opens theWhiskerapp. - The mobile app then reaches out to the static IP (192.168.4.1) and begins the configuration process.
- The user gives the robot a name, selects the wireless network they would like it to connect to, and the mobile app sends the data to the device.
- The robot now restarts itself to exit the pairing process, and connects to the configured wireless network.
Because the device broadcasts it’s own network during on-boarding, I thought of a pretty scuffed idea to capture this traffic, behold:
- Laptop with extra wireless device connects to the device’s
litter-robotwireless network. - Laptop also broadcasts it’s own network, let’s call it
laptop-robot. - Make the
litter-robotnetwork reachable when connected to thelaptop-robotnetwork and configure Wireshark or other packet capture software. - Phone connects to
laptop-robotand begins the on-boarding process. - Traffic can be capture on the laptop :)
There is probably a cleaner way to do this, but it worked, I was able to start seeing the traffic sent from the mobile mobile app to the device and vice versa. The Litter Robot communicates over UDP, therefore there was a lot of noise initially, however it only took a few minutes to identify the communication stream between the mobile app and the device.
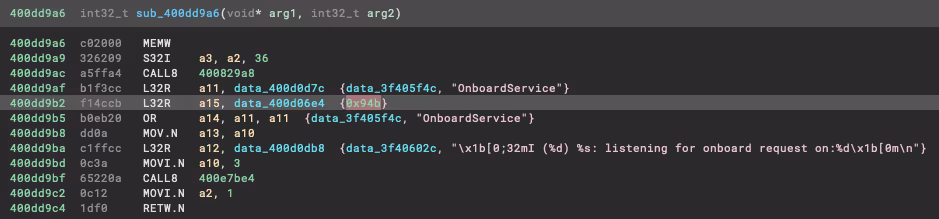
The mobile app was communicating to the device on port 2379 and was receiving the responses on port 2380. I was able to verify this inside Binary Ninja by searching for the hex representation of 2379 (0x94b), as you can see here it looks like we are on target:
Loading the capture into Wireshark allowed for a quick ASCII based view of the UDP conversation:
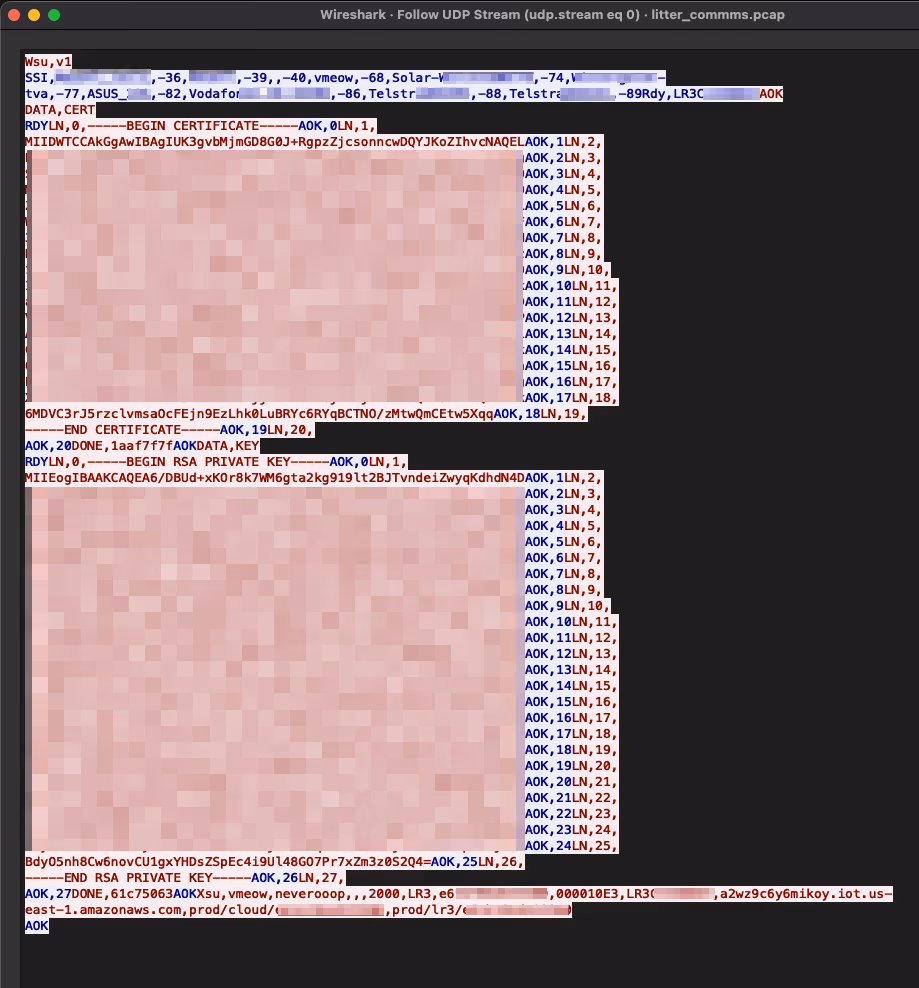
Deconstruction of this message is as follows:
- The mobile app sends
Wsu,v1and the device responds with a list of wireless networks that it can see (this is then reflected in the mobile app when choosing desired network to join). - The devices also sends back
Rdy,LR3{ID}indicating it’s ready for the next message and including the device ID. - The mobile app sends
AOKto acknowledge the device state and then indicates that it will begin sending a certificate withDATA,CERT. - The device responds with
RDYand is now expecting the mobile app to send the certificate line by line. - The mobile app indicates the line number using the
LN, {line number}prefix and the device responds withAOK, {line number}. - The mobile app then sends
DONE, 1aaf7f7f(CRC-32 of the final entire message).
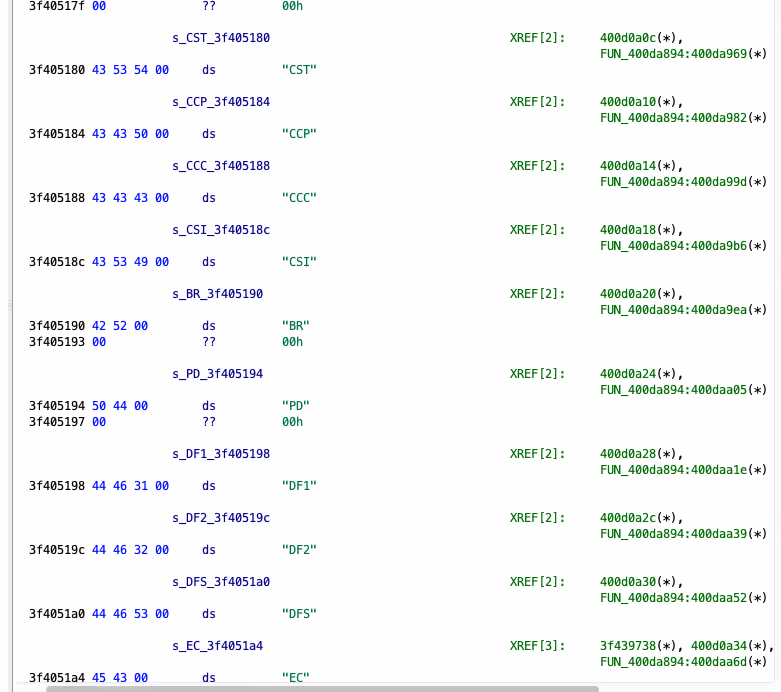
The steps are repeated for the certificate key until we reach the final message. The message includes the wireless network name and password I gave it, as well as some AWS IOT endpoints and details that we can see in the mobile analysis further down. You will notice that the string I mentioned earlier in the firmware appears to be the header values for this message:
What was the purpose of this you ask? Well, I was able to replicate this on-boarding process using just scapy, we can also manipulate the values, for example the endpoints, ports, etc. However I stopped there as the communication expected a TLS connection, this may help others though.
Here is the `scapy` script I ended up with
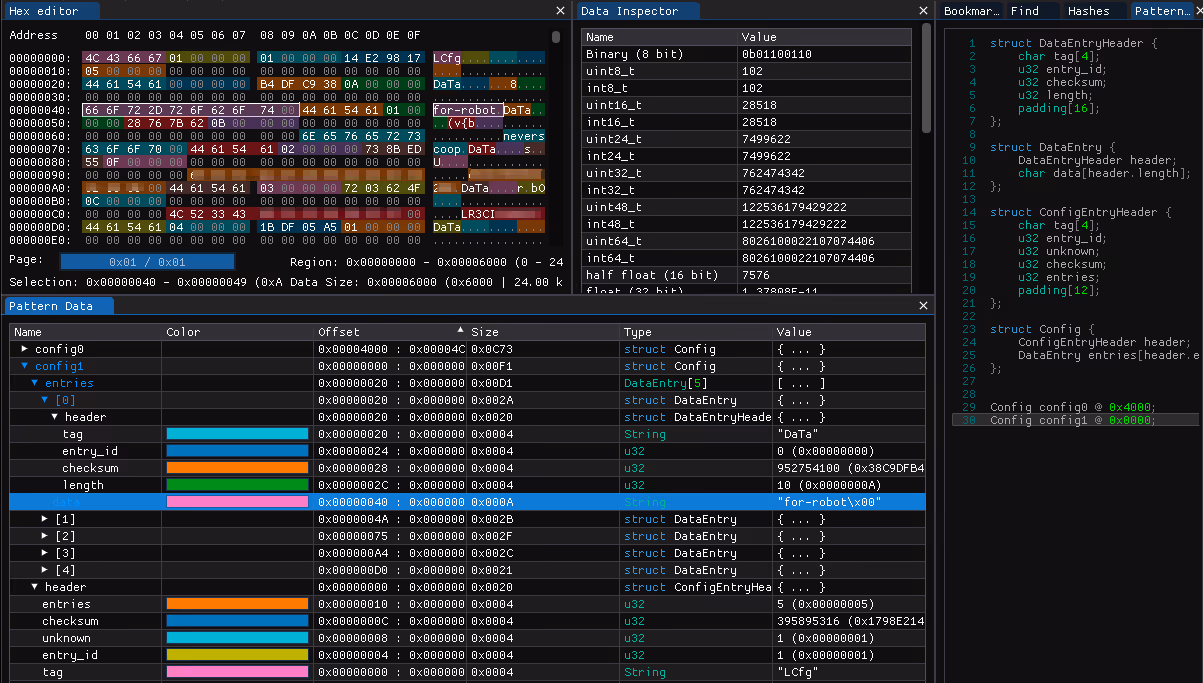
It’s also worth pointing out that at this point, I took a little step back, and remembered the config partition from the firmware dump I looked at earlier, initially it looked like this:
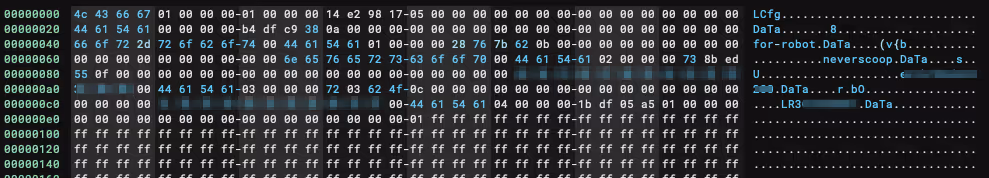
With a little bit of massaging, it was possible to create an ImHex pattern that would group the values into a more logical view, we can now see each stored data item, the value and the CRC32_le hash stored for each value:
Mobile and API
This is the final piece of the Litter Robot universe that I had a poke at during this review.I didn’t want to spend too much time on the mobile applications as the intention was to learn the various other areas of reverse engineering… however, famous last words, I got sucked into the world of ‘Flutter’.
I won’t go into too much detail on Flutter as there are various resources already out there, but to put it into a nutshell, Flutter is a mobile development framework that is able to build releases across all mobile platforms (ios & Android). The coding language itself is ‘Dart’ and is compiled natively.
There is an excellent mini series on reverse engineering Flutter over at Guardsquare, in the article the main pain points have been highlighted:
- The Dart AOT snapshot format is changing a lot with each update.
- All Dart frameworks are statically linked in the application binary.
- The Dart code relies on the Dart VM to be executed.
I highly recommend reading the article mentioned above, I went through the series and attempted to clean up the dissasembly as described but there is still a lot more work to be done there. Anyway, in this section I will briefly go over the steps taken to begin looking at the iOS application, and then some insights and HTTP traffic analysis served with a sneaky vulnerability (that may need to be published later sorry).
iOS Application
Some pre-requisites:
- iPhone that has been jailbroken.
- frida installed on the device and the tool-set installed on your machine.
- Whisker mobile app installed on the device.
First things first, we need to extract the application IPA file, let’s start by grabbing the common name of the app:
Next up I used frida-ios-dump and iproxy to extract the IPA file.
- Initiatlise
iproxyto listen on local port 2222. This will route traffic from USB SSH port 44 of the iOS device.
- Using
frida-ios-dump, extract the IPA with the common name identified earlier.
Awesome, now I’ll save you some time and reveal that the mobile app is written in Flutter (woo, not really). The best way I found to get a little deeper for this particular mobile app was using reFlutter. It will patch the IPA file itself to dump the classes, functions and fields at runtime of the app. Using the tool is simply, simply run:
You’ll then want to install the newly patched IPA back on to the phone via your method of choice (I used Filza).
When you first run the patched app, reFlutter will create a dump.dart file within the Documents directory of the app’s local storage. We can extract that using a number of tools, in my case I used grapefruit and navigated to the folder.
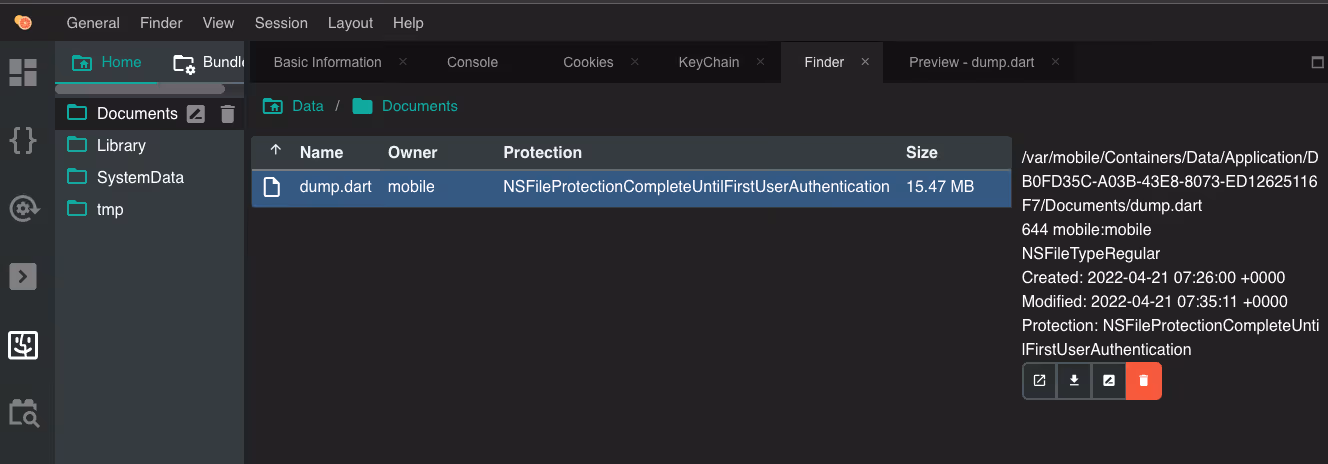
The dump.dart file contains a large array of classes, functions and fields as mentioned earlier. The structure of each item will indicate the name of the function (or object/field), and the code offset. For example the following snippet corresponds to the _sendLoginRequest function and indicates the code offset to be at ` _kDartIsolateSnapshotInstructions + 0x0000000000163cf4`:
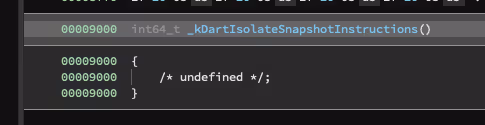
What is _kDartIsolateSnapshotInstructions? I’m glad you asked, this is the Snapshot offset within the application libapp.so file. In this case the iOS binary had been combined into a single App file, so I opened that up in Binary Ninja and noted the address of _kDartIsolateSnapshotInstructions to be 0x9000.
We can now use this information inside the frida.js hooking template provided to hook this function.
When we load script and the application through Frida and send a sample login with the username test, we will see outputs like this:
We can see the string test has been dumped from the second argument in the function, cool! I hope this helped give an understanding of the depth you might end up with when having a look at a Flutter application, I’ll leave the rest of the Flutter fun to you and move on to the API.
Mobile API
For Mobile traffic inspection I am using Burp Suite, set-up for the interception proxy was simple and there are plenty of guides on getting started with Burp Suite so I will skip to the fun stuff.
The first thing I noticed in the traffic was a few requests to the GraphQL endpoint https://graphql.whisker.iothings.site/v1/graphql. Naturally I decided to do a quick introspection query to see if the schema was available. It was! And after plugging the result into GraphQL Voyager I had a nice overall view of the schema:
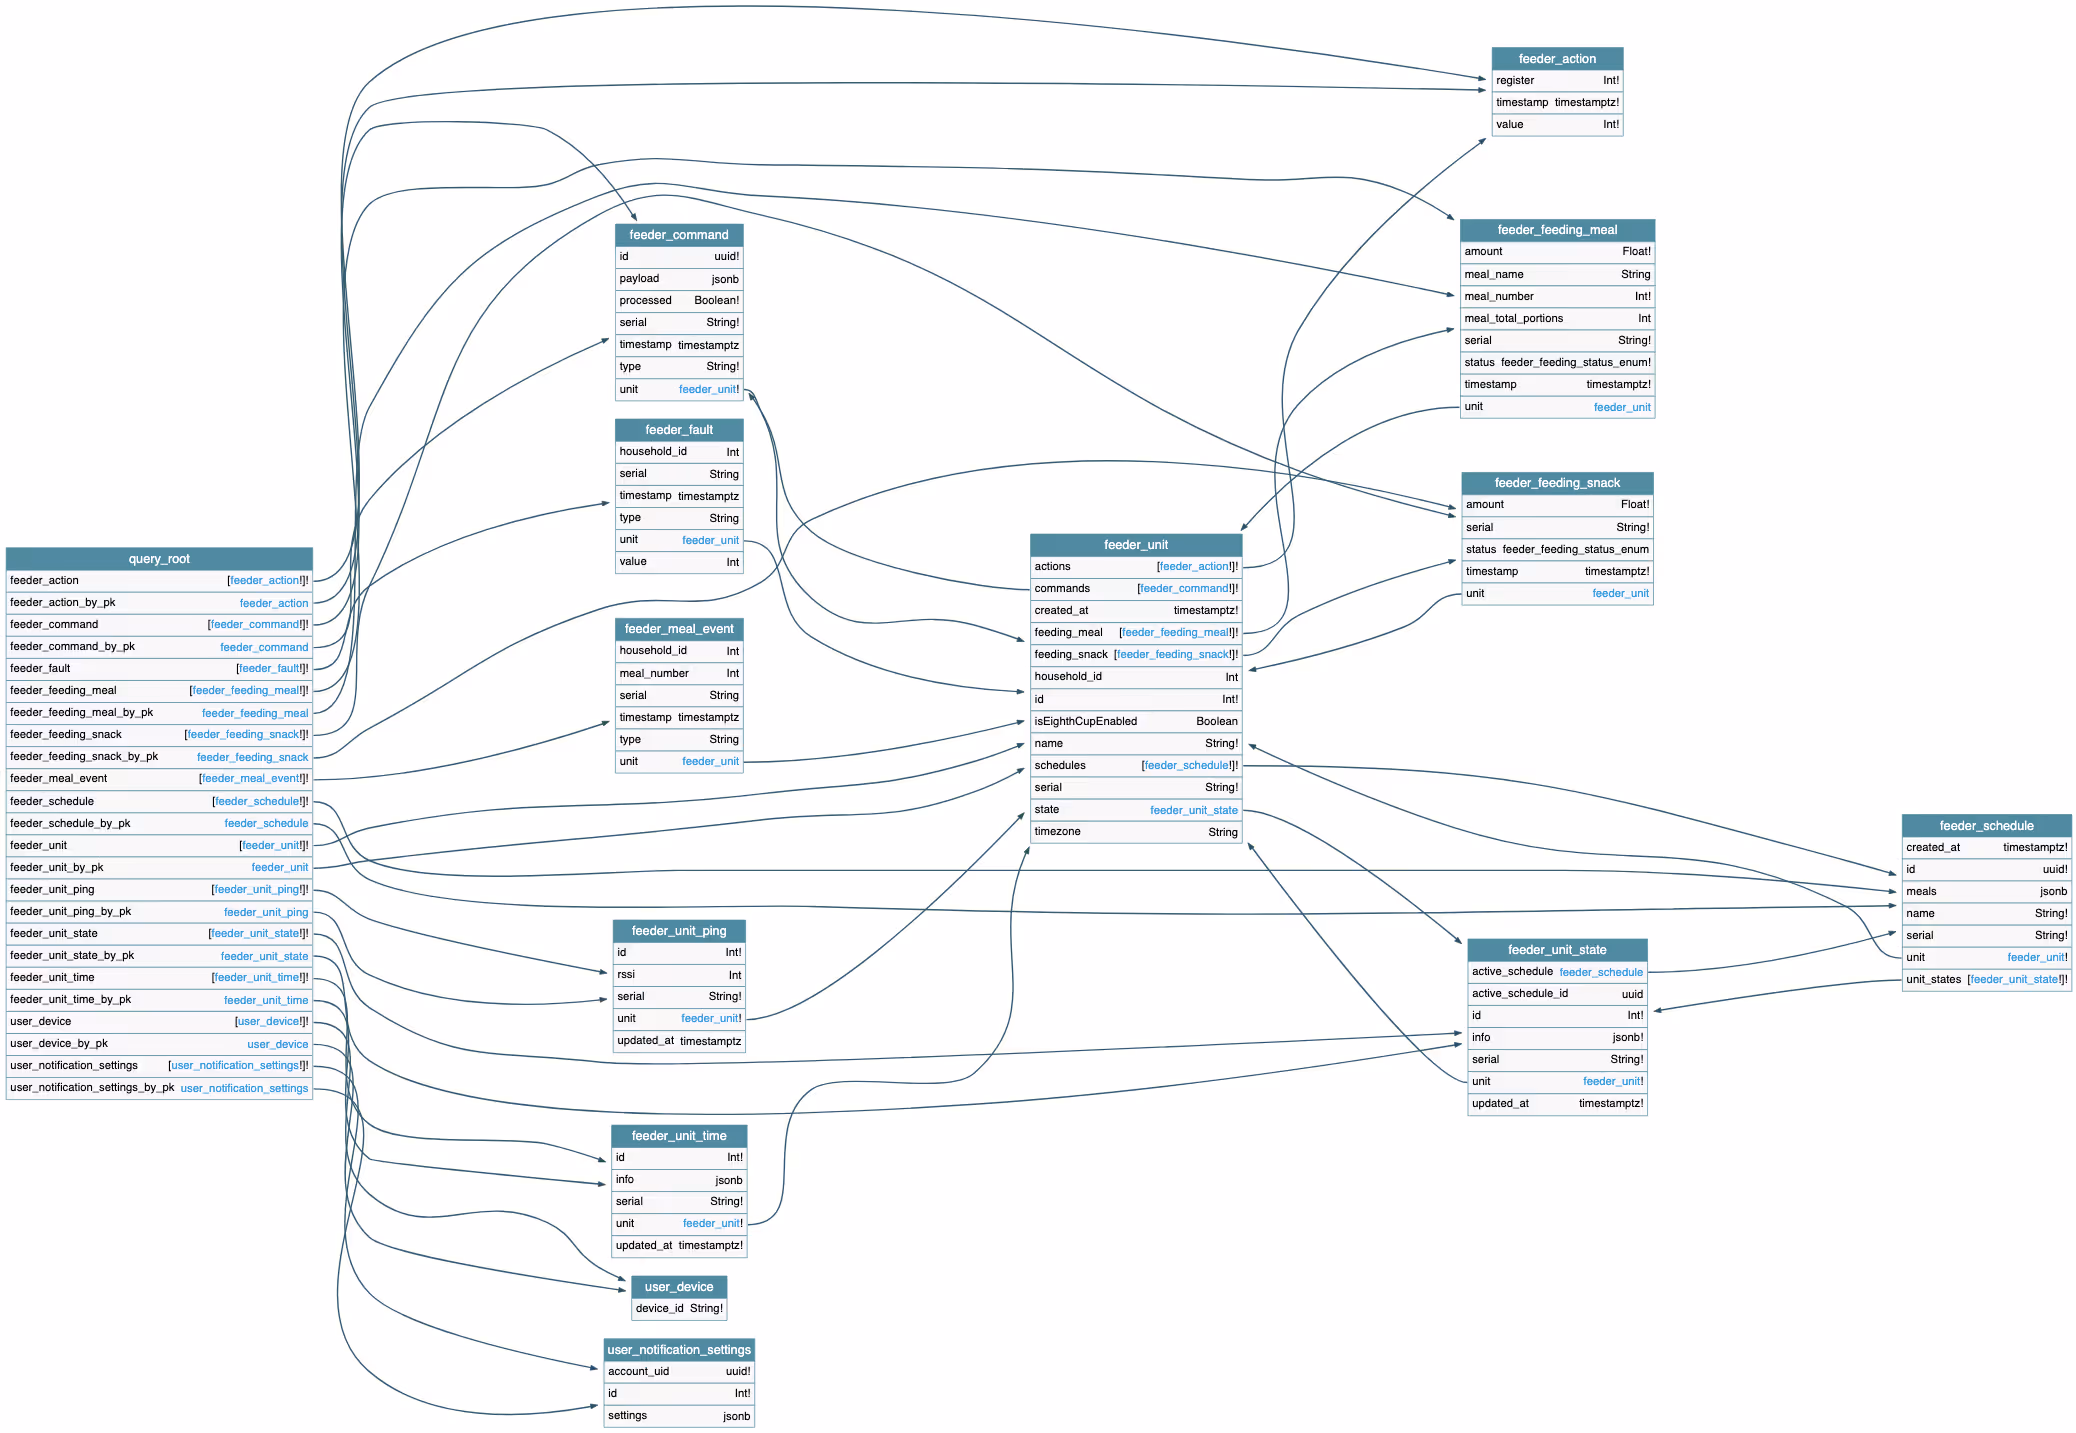
Yeah it’s not the best image to insert into a blog, but as far as GraphQL Schemas go, it’s pretty small. It also revealed pretty quickly that this GraphQL API was not intended for the Litter Robot, and only handled the user notifications portion of the mobile application.
Moving on, let’s take a look at the on-boarding flow and command dispatch, this is where everything started to come together and everything you have read so far might make a little more sense.
Register device
The first request made during on-boarding is to https://v2.api.whisker.iothings.site/users/1065769/robots, the payload structure looks like this:
And here is where it gets interesting, this is what we see in the response:
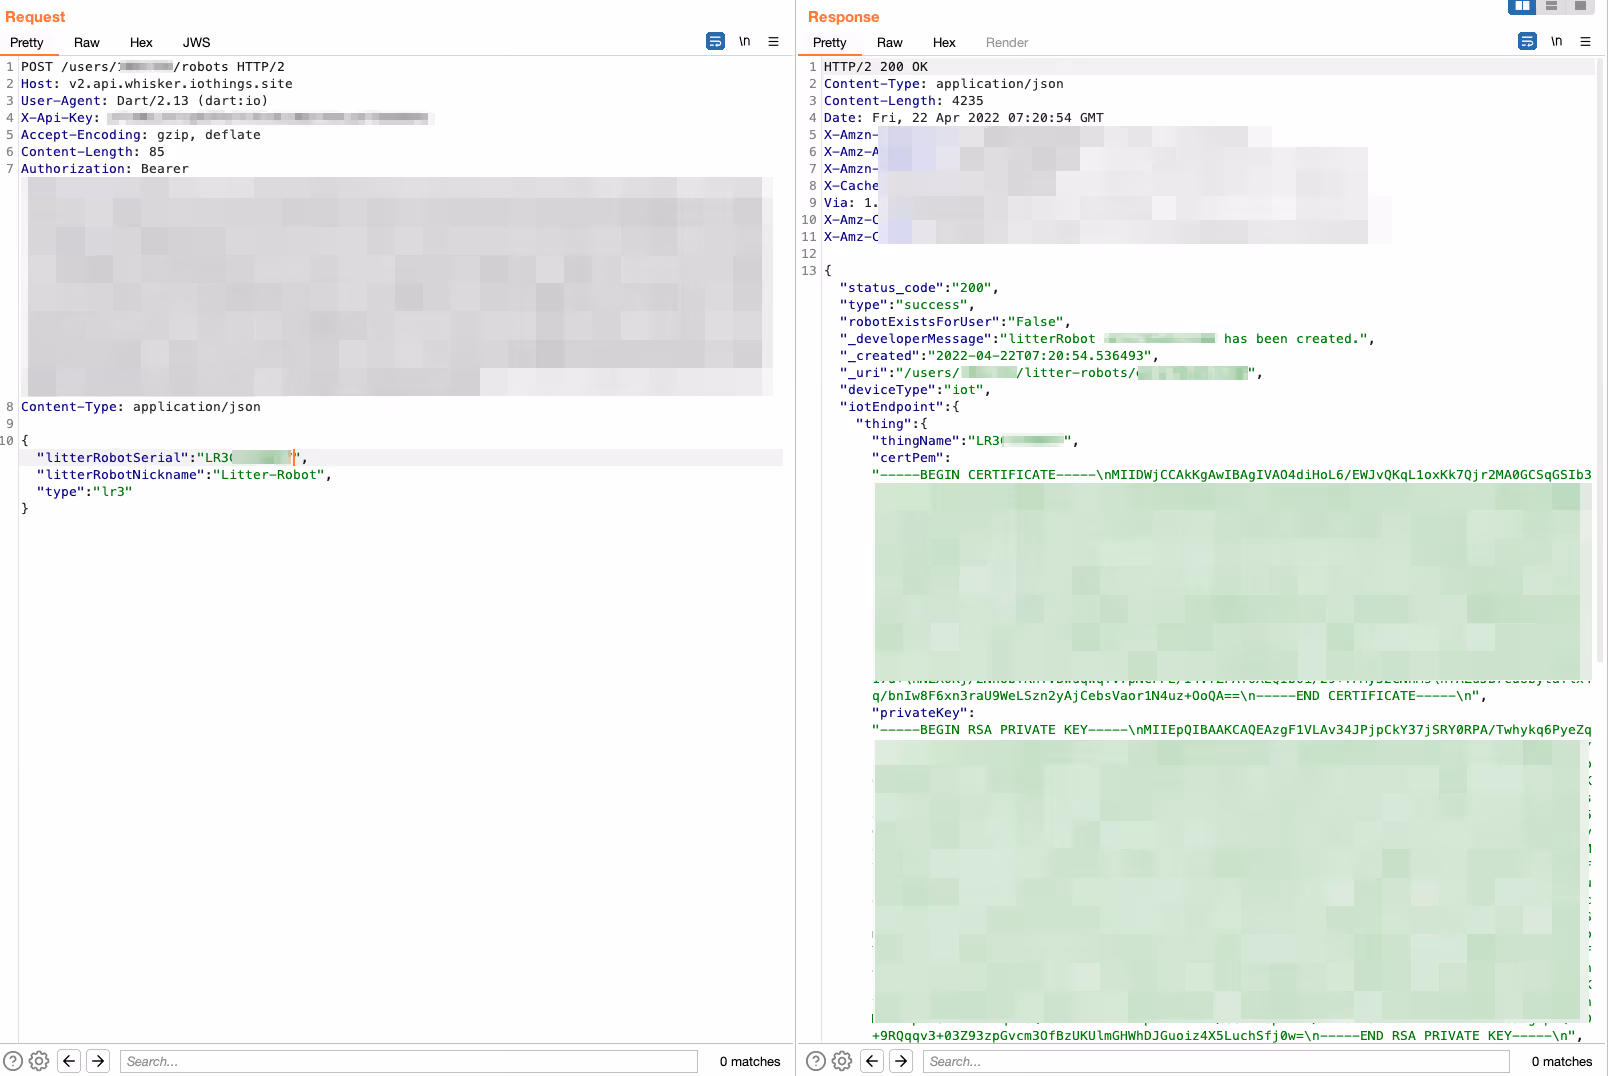
That’s right! It’s the certificate pair and URL that we saw in the UDP packets sent to the device during on-boarding. We can now piece the puzzle together, these are part of the AWS IoT Core framework. A quick look into the setup guide shows that when a new device is registered, a certificate pair is created and must be used with the device/API in order to communicate with AWS IoT Core.
So that’s what is happening in our on-boarding process, the device is being registered in the Litter Robot instance of AWS IoT Core, and then the paired certificates along with the correct endpoints for the user and device ID are stored on the device’s config partition on the flash memory.
Wrap-up
Thank you for making it this far! When I took on this project I had a few goals in mind, and I completely lost myself in all the different aspects that were involved, spending time on each part became addictive and a lot of time was simply lost in a wave of browser tabs, red bull and error messages or unreadable byte code. I hope you learnt something, or are inspired to take this further.