ESP-IDF setup guide
A guide on setting up an environment for ESP32 vulnerability research.
A guide on setting up an environment for ESP32 vulnerability research.
Since 2016 the ESP32 has steadily become a ubiquitous component to many devices in the world, from IoT consumer devices through to industrial systems. With this rise of popularity comes an increased relevance for security research opportunities to understand the evolving security features of the chipset and the knock-on security considerations for smart devices.
In recent years there has been some solid research articles targeting the ESP32, with a couple of notable examples being blog posts from LimitedResults that detail attacks such as bypassing the secure boot using fault injection and achieving a full readout of FEK and SBK via voltage glitching. If reading such posts or watching their Blackhat presentation triggers an aspiration for similar levels of pwnage, going down the path of following a guide such as Espressif Get Started guide is a sensible start. However, you may quickly find most guides will create an environment that miss a couple of features that come in handy when getting into the weeds of vulnerability research.
In this post we share a guide that adds some key features for security auditors to a Linux test environment for Espressif’s IoT Development Framework (esp-idf), which is the defacto development framework used by projects targeting the ESP32 series of microcontrollers. The environment includes an LSP server which is useful for code review, as well as an emulator for the ESP32 MCU/eFuses which enables rapid build, test, and debugging of framework components without requiring a physical device.
The instructions assume you’re running Ubuntu Linux 20.04 LTS on x64, but will work on other distros too with minor adjustments. The instructions also assume you have the following environment variables SRC_HOME, WORKSPACE_HOME, and PROJ_HOME configured, which should look something like the following:
# Where to download code and inc. dependencies
export SRC_HOME="${HOME}/src"
# Where to put our "workspace" related repos
export WORKSPACE_HOME="${SRC_HOME}/audit"
# Where to put our demo/target project
export PROJ_HOME="${WORKSPACE_HOME}/hello_world"
As we’ll be building lots of projects from source and running CPU intensive tasks, you should ensure your computer has decent resources available. The author has used a VM with 4 cores, 8GB RAM + swap, and 128GB disk space available.
The most accurate information on downloading and installing esp-idf is found in the official docs at https://idf.espressif.com/. However, you can run the following commands to get set up quickly, which will install dependencies and clone the esp-idf framework repo. It will also install cross-compiler/debug toolchains which target the Tensilica Xtensa ISA (ESP32 CPU):
Note: This will also copy a hello_world project from the esp-idf examples into your ${PROJ_HOME} directory. You could use any example/real-world project you like though.
sudo apt-get install -y git wget jq flex bison gperf python3 python3-pip python3-setuptools python3-venv cmake ninja-build ccache libffi-dev libssl-dev dfu-util libusb-1.0-0 && \
git clone --recursive https://github.com/espressif/esp-idf.git ${WORKSPACE_HOME}/esp-idf/ && \
${WORKSPACE_HOME}/esp-idf/install.sh esp32 && \
cp -r ${WORKSPACE_HOME}/esp-idf/examples/get-started/hello_world ${PROJ_HOME}
Once you have the esp-idf framework and toolchains installed, you will need to run the following command to configure your PATH and other environment variables:
source ${WORKSPACE_HOME}/esp-idf/export.shThe next step is to configure your project which is located in ${PROJ_HOME}. The first thing you’ll need to do is set the target MCU for the project, which in our case will be esp32:
idf.py -C ${PROJ_HOME} set-target esp32Before building the code you can configure project components, peripherals, and boot related settings by running idf.py -C ${PROJ_HOME} menuconfig. Once the project is configured to your liking, you can build with the following command (CMAKE_EXPORT_COMPILE_COMMANDS=1 will create a compile_commands.json file which is used by our language server later):
CMAKE_EXPORT_COMPILE_COMMANDS=1 idf.py -C ${PROJ_HOME} build
The next step is to configure a language server, which will allow us to easily navigate the projects codebase with accuracy when using features like goto definition and find references. My preferred language server for C/C++ code is ccls. However, before we can use it we’ll need to build our own version of LLVM which supports the Xtensa architecture. Fortunately, this is straightforward as Espressif provide a llvm-project fork found here. We just need to run the following commands to clone that repo and build LLVM:
git clone https://github.com/espressif/llvm-project.git ${SRC_HOME}/llvm-project &&\
cd ${SRC_HOME}/llvm-project && \
cmake -S llvm -B build -G Ninja -DCMAKE_BUILD_TYPE=Release \
-DLLVM_ENABLE_PROJECTS="clang;clang-tools-extra" -DLLVM_TARGETS_TO_BUILD=Xtensa \
-DLLVM_EXPERIMENTAL_TARGETS_TO_BUILD=Xtensa && \
ninja -C build
Assuming your LLVM built without errors, you can then proceed to clone ccls and build/link against our LLVM as shown in the following commands:
Note: It’s OK to ignore the error fatal: No names found, cannot describe anything.
git clone --depth=1 --recursive https://github.com/MaskRay/ccls ${SRC_HOME}/ccls && \
cd ${SRC_HOME}/ccls && \
cmake -H. -BRelease -DCMAKE_BUILD_TYPE=Release -DCMAKE_PREFIX_PATH=${HOME}/src/llvm-project/build/ && \
cd Release && \
sudo make install
Now that your language server is built/installed, the next step is to configure it by creating a .ccls config file in your ${WORKSPACE_HOME}. The settings we configure instruct ccls to use the compile_commands.json file generated by idf.py build to parse source files, while also giving some additional settings related to target architecture/headers which is needed for its LLVM backend:
touch ${WORKSPACE_HOME}/.ccls-root
cat > ${WORKSPACE_HOME}/.ccls<<EOF
%compile_commands.json
--target=xtensa-esp32
--gcc-toolchain=$(echo ${PATH} | tr ':' '\n' | grep xtensa-esp32-elf | xargs dirname)
EOF9/06/22 Update: In retrospect, using vscode isn’t the best example of why we’re using ccls 😅 The author actually uses Emacs, where vscode-cpptools isn’t an option.
The final step in configuring LSP is to configure your editor. We’ll use Visual Studio Code in our example, but many other editors are supported too (just see here). Start by installing the ccls-project.ccls extension, and configure its compilationDatabaseDirectory setting to the location of your compile_commands.json file. It’s typically located in your ${PROJ_HOME}/build directory, but if you’re interested in reading bootloader related code you will need to use the file under ${PROJ_HOME}/bootloader/.
code --install-extension ccls-project.ccls && \
mkdir -p ${WORKSPACE_HOME}/.vscode && \
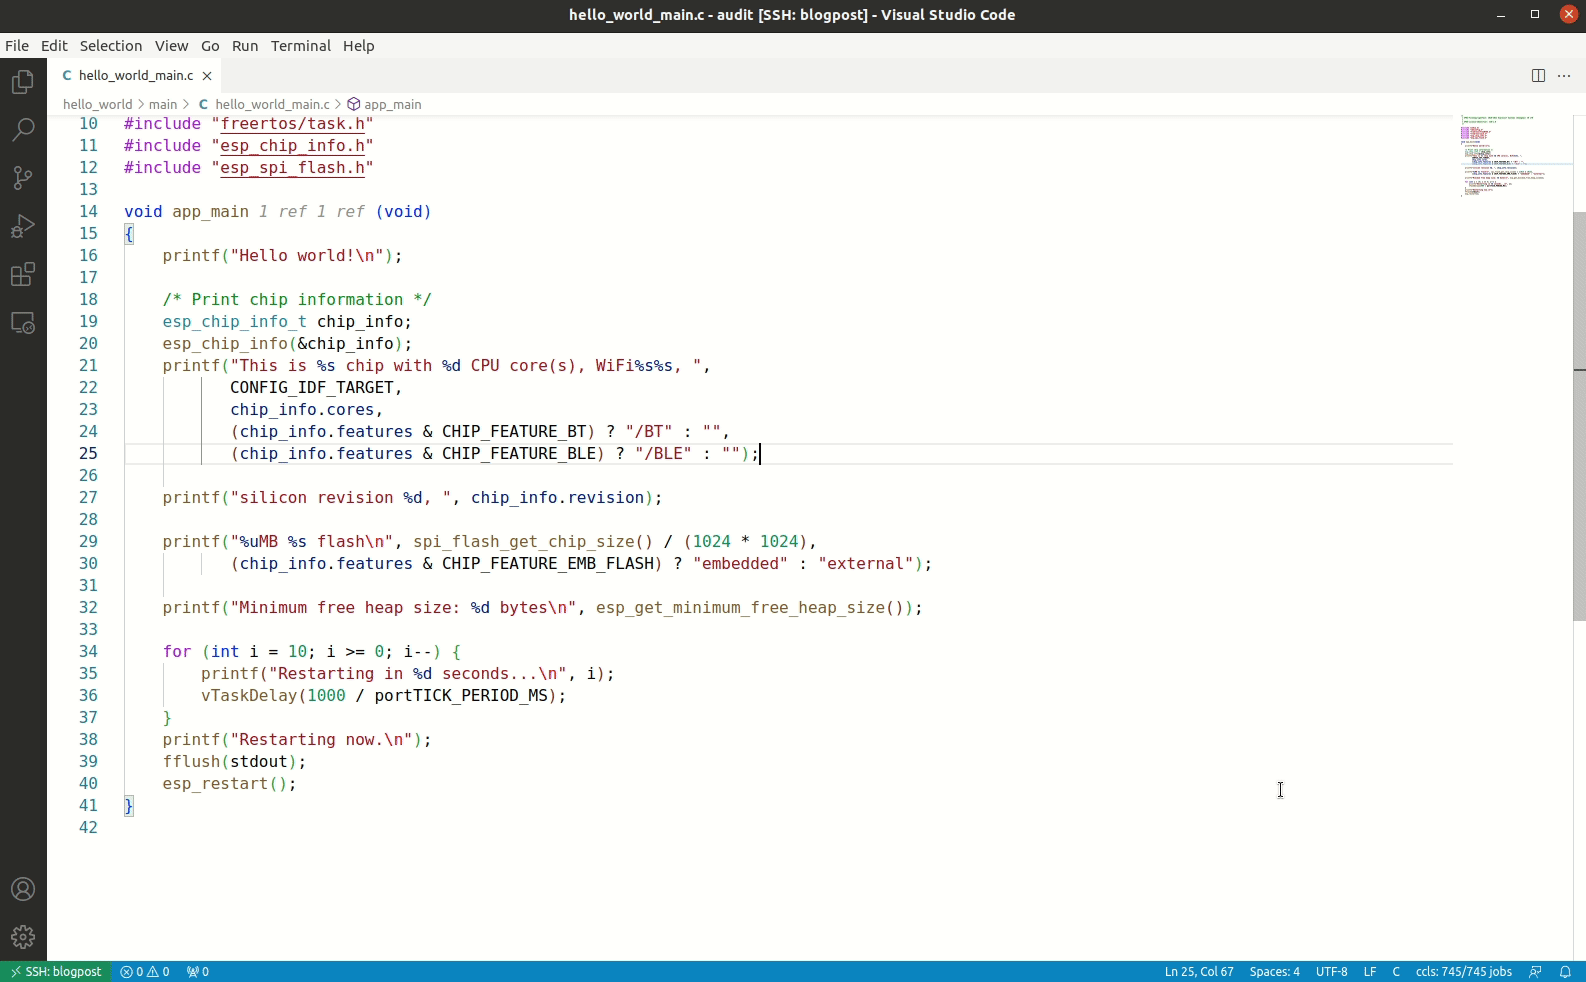
jq -n ".\"ccls.misc.compilationDatabaseDirectory\"=\"${PROJ_HOME}/build\"" > ${WORKSPACE_HOME}/.vscode/settings.jsonAt this point you’re ready to open your ${WORKSPACE_HOME} folder in Visual Studio Code, and the ccls extension will automagically index the code base and give you enhanced navigation features as shown below:
While it’s great being able to build your own firmware and develop with LSP support, there are some cases where it can be useful to run your firmware without needing to have a physical device. Fortunately, Espressif have forked QEMU and provide support for the ESP32. You’ll need to install dependencies and build from source as shown below:
Note: This will enable deb-src repos to your list of apt repositories.
sudo sed -i '/deb-src/s/^# //' /etc/apt/sources.list && \
sudo apt-get update && \
sudo apt-get install -y libgcrypt20-dev && \
sudo apt-get build-dep -y qemu && \
git clone https://github.com/espressif/qemu.git ${SRC_HOME}/qemu && \
cd ${SRC_HOME}/qemu && \
./configure --target-list=xtensa-softmmu --enable-gcrypt --enable-debug --enable-sanitizers --disable-strip --disable-user --disable-capstone --disable-vnc --disable-sdl --disable-gtk && \
ninja -C build
The next step is to boot QEMU in “flash download mode” by setting a GPIO strap. We’ll also use an empty 8MB file to act as SPI flash memory, and another 124 byte file to act as eFuse storage.
truncate ${PROJ_HOME}/qemu_flash.bin -s 8M && \
truncate ${PROJ_HOME}/qemu_efuse.bin -s 124 && \
${SRC_HOME}/qemu/build/qemu-system-xtensa -nographic \
-machine esp32 \
-drive file=${PROJ_HOME}/qemu_flash.bin,if=mtd,format=raw \
-drive file=${PROJ_HOME}/qemu_efuse.bin,if=none,format=raw,id=efuse \
-global driver=nvram.esp32.efuse,property=drive,value=efuse \
-global driver=esp32.gpio,property=strap_mode,value=0x0f \
-serial tcp::5555,server,nowait
In another terminal window, we can flash our firmware to the VM with the following command:
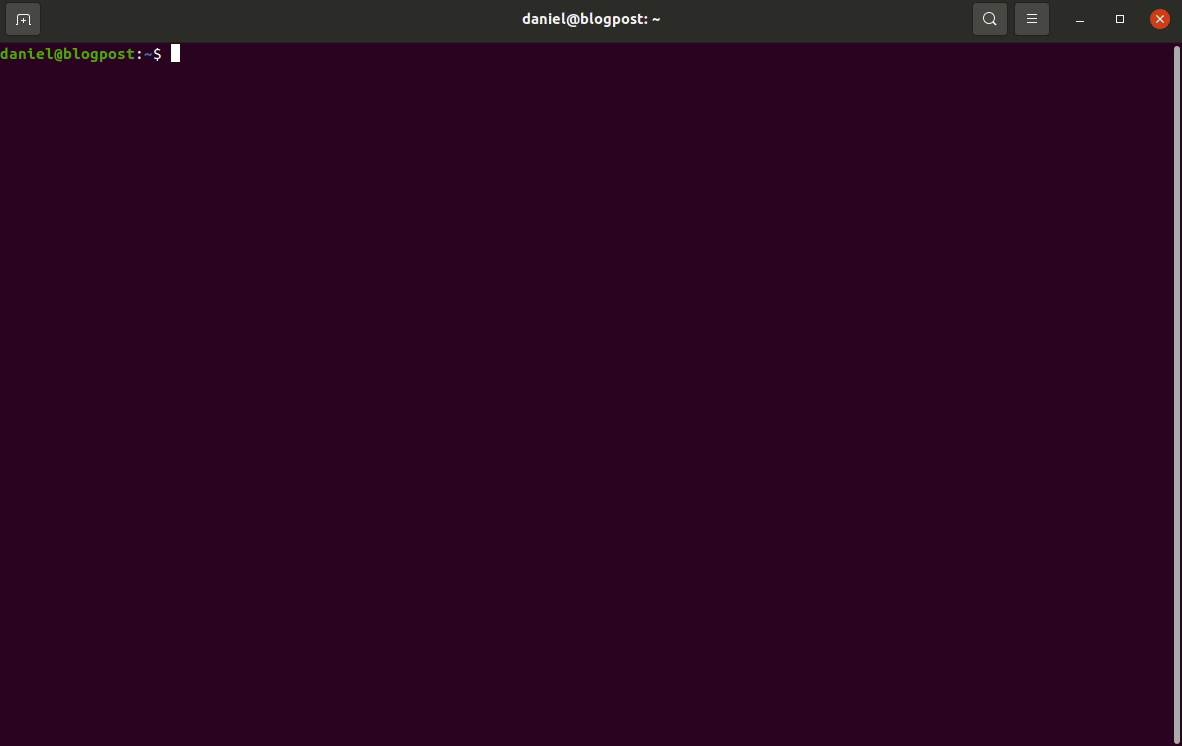
ESPPORT=socket://localhost:5555 idf.py -C ${PROJ_HOME} flashIf everything goes well you should see something like the following:
Finally, you can now run your newly flashed firmware by launching QEMU in normal boot mode with the following command:
Note: You can quit QEMU by typing Ctrl-A x. Other useful information on running QEMU can be found in the Espressif wiki at wiki.
${SRC_HOME}/qemu/build/qemu-system-xtensa -nographic \
-machine esp32 \
-drive file=${PROJ_HOME}/qemu_flash.bin,if=mtd,format=raw \
-drive file=${PROJ_HOME}/qemu_efuse.bin,if=none,format=raw,id=efuse \
-global driver=nvram.esp32.efuse,property=drive,value=efuse
Debugging firmware in QEMU is actually pretty straight forward, only requiring you to add the -s -S command line arguments as shown below:
${SRC_HOME}/qemu/build/qemu-system-xtensa -nographic \
-machine esp32 \
-s -S \
-drive file=${PROJ_HOME}/qemu_flash.bin,if=mtd,format=raw \
-drive file=${PROJ_HOME}/qemu_efuse.bin,if=none,format=raw,id=efuse \
-global driver=nvram.esp32.efuse,property=drive,value=efuse
QEMU will wait for your debugger to attach before continuing, which you can do with the following command:
xtensa-esp32-elf-gdb ${PROJ_HOME}/build/hello_world.elf \
-ex "target remote :1234" \
-ex "monitor system_reset" \
-ex "tb app_main" \
-ex "c"
If everything goes well you’ll be single-stepping in no time:
In this post we’ve shared how to set up a useful audit environment for security researchers interested in learning more about ESP32 and the esp-idf framework. Navigating complex code-bases with many compile-time options becomes a refreshingly smoother process using the configured language server. In some instances where a vulnerability is discovered or runtime debugging would be useful, it’s also possible to run your ESP32 firmware in QEMU, which comes with a bunch of additional advantages.
It’s worth noting that it’s possible to use QEMU to emulate firmware pulled directly from external flash of arbitrary ESP32 devices. This provides lots of advantages for bug hunting, for example one could use nbdkit to Person-in-the-middle (PITM) flash access in the pursuit of finding TOCTOU issues.
That’s all for now folks, thanks for reading and happy hacking!
ESP-IDF setup guide
March 2025 - New Method to Leverage Unsafe Reflection and Deserialisation to RCE on Rails
October 2024 - A Monocle on Chronicles
August 2024 - DUCTF 2024 ESPecially Secure Boot Writeup
July 2024 - plORMbing your Prisma ORM with Time-based Attacks
June 2024 - plORMbing your Django ORM
January 2024 - Keeping up with the Pwnses
elttam is a globally recognised, independent information security company, renowned for our advanced technical security assessments.
Read more about our services at elttam.com
Connect with us on LinkedIn
Follow us at @elttam
 New Method to Leverage Unsafe Reflection and Deserialisation to RCE on Rails
By Alex Brown March 04, 2025
This blog article documents a new unsafe reflection gadget in the sqlite3 gem, that can also be used in a deserialisation gadget chain to achieve RCE and is installed by default in new Rails applications.
 A Monocle on Chronicles
By Matt October 02, 2024
This post provides an overview of Talkback Chronicles for viewing snapshots of trending infosec resources for points in time, and also how to subscribe to a new weekly Newsletter feature.
 DUCTF 2024 ESPecially Secure Boot Writeup
By daniel August 01, 2024
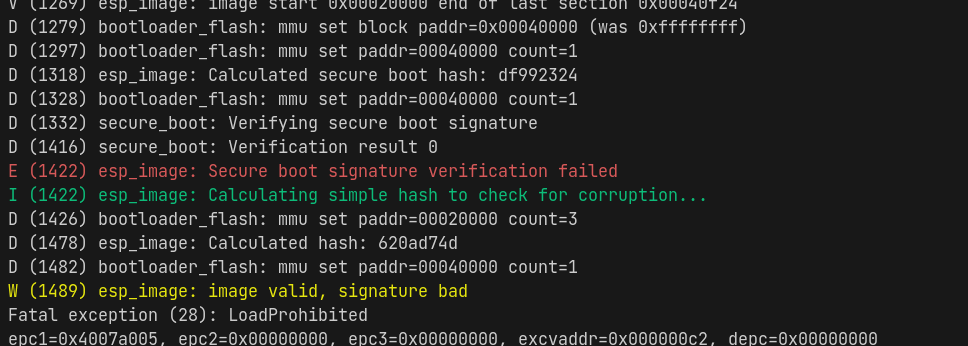
This blog post covers a DUCTF 2024 pwn challenge called "ESPecially Secure Boot", which required writing an exploit for CVE-2018-18558.