RE of LR3
Peeking under the bonnet of the Litter Robot 3
Peeking under the bonnet of the Litter Robot 3
As a cat loving hacker, when I found out that I wasn’t the only one at elttam with an automated cat litter device, I began to wonder what interesting things I may find when doing a small tear down of the Litter Robot’s components including the PCB, firmware, and mobile application. Since I come from a web security background, this research would be an opportunity to learn new topics - and I hope by writing about my approach it helps others in a similar situation. So, please follow me on my journey to understanding the extraction and analysis of an ESP32 IOT device, reverse engineering a Flutter mobile application, and capturing and analysing the network traffic between the device, the mobile app and the internet.
Note: This work was done a while ago, and focussed on the Litter Robot 3. The manufacturer has since come out with the Litter Robot 4 - which presumably has new software, features, and possibly hardware configuration.
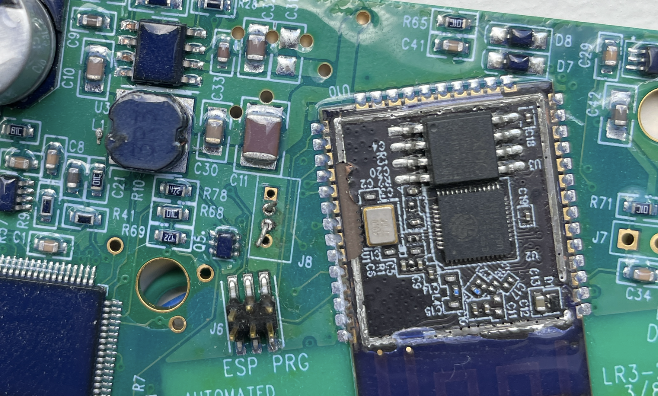
I began by pulling out the main board from the device and looking for interesting tells of which chip is in use, the wireless technology in use, whether there may be existing ports/outputs that could give clues into debugging the device.
Initial visual inspection reveals the following:
ESP PRG 6 pinout as well.

My initial assumption was that there would be a few paths I could take:
ESP PRG sounds like some kind of programming interface, maybe there is a way to communicate there.ESP PRG provided an obvious communication interface to the device (I’m probably wrong here too).After failing to determine any potential UART interfaces on the free pinouts, I turned to the 6 pin ESP PRG pins. Looking online it appears that Expressif supplies a programming board called the ESP-Prog which can be used to communicate with the ESP32. The ESP-Prog supports a standard programming output as well as a JTAG interface.
I called up Dan, who you may remember from ESP-IDF SETUP GUIDE, who happened to have an ESP-Prog board handy and within a day I had one in my hands. I also followed similar steps to set up the ESP-IDF toolkit.
I plugged the supplied cable from the 6 pin ESP PRG interface on the device to my new ESP-Prog board and then connected the board to my computer via USB. Using the ESP-IDF kit, I ran the following command:
$ idf_monitor.py --port /dev/ttyUSB1
Aaaaand… I got nothing. Great. What did I do wrong?
It turns out that the 6 pin ESP PRG interface does not actually line up to the dev board I have and I’ll need to find the true pinout structure. This is also something I probably should have checked with my trusty multimeter as I did with the rest of the pinouts, but here we are.
ESP-Prog interfaceI figured there must be some dedicated pinouts from the chip itself for the programming interface, so I grabbed the datasheet for the ESP32-WROOM-32D from the Expressif site and began to map out the pins required.
First of all, the ESP-Prog board has the following structure:
| 3.3v | GND | ESP_IO0 |
| ESP_EN | ESP_TXD | ESP_RXD |
The necessary pins are:
Going back to the datasheet, we can see that the required pins match to the following chip pin positions:
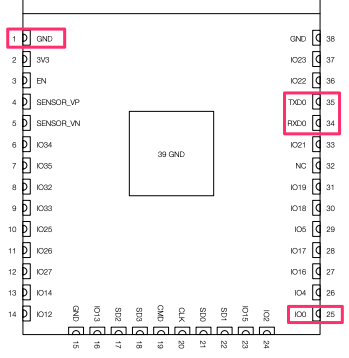
I then took out my multimeter in continuity mode and placed one prong on the chip pin and one on the ESP PRG pin to identify the corresponding outputs, mind you I had to scrape the resin that was covering the connectors on the chip and you don’t want to see how that turned out.
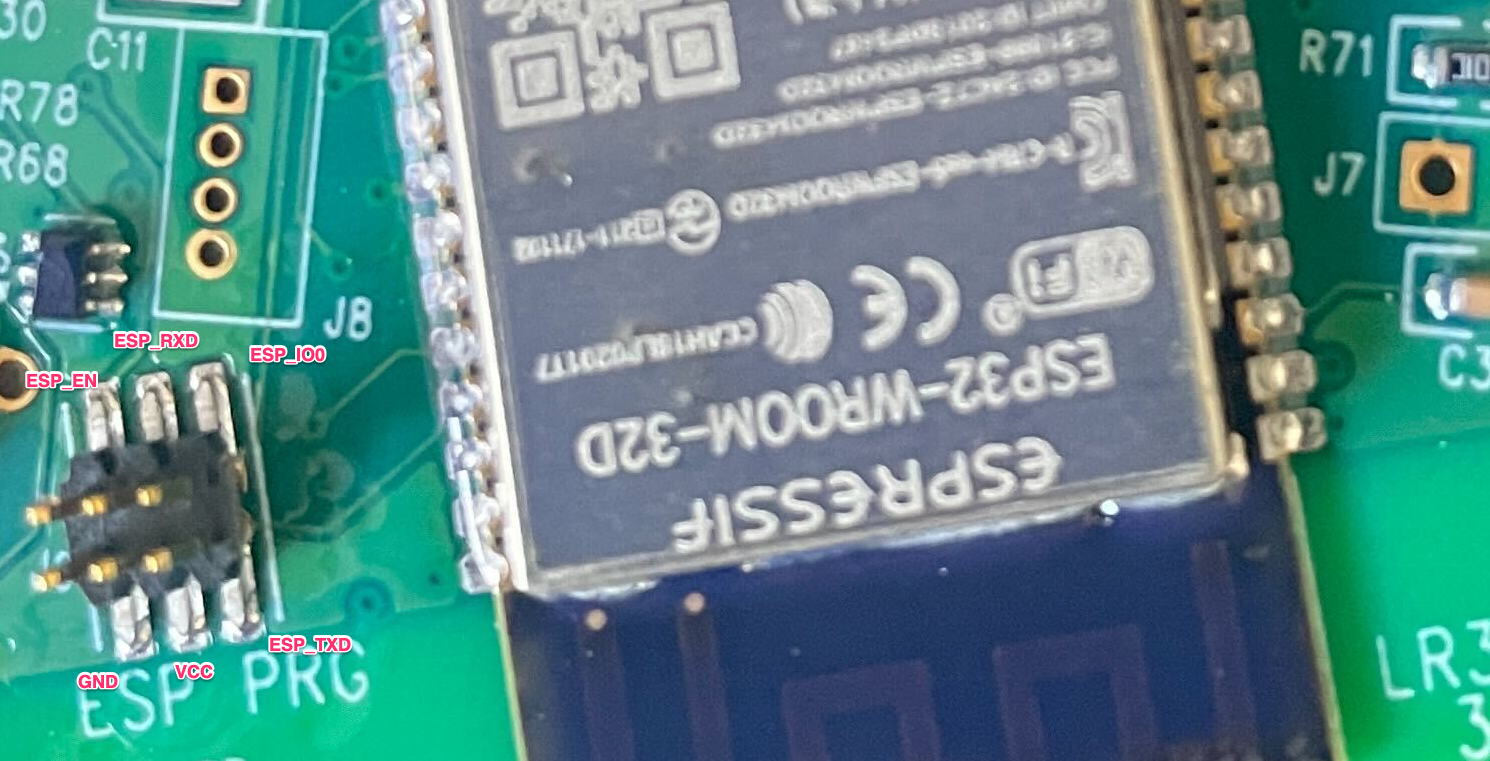
I then soldered some wires from the underside to keep it neat, or maybe to hide the mess, and ran the pins to the programmer board.
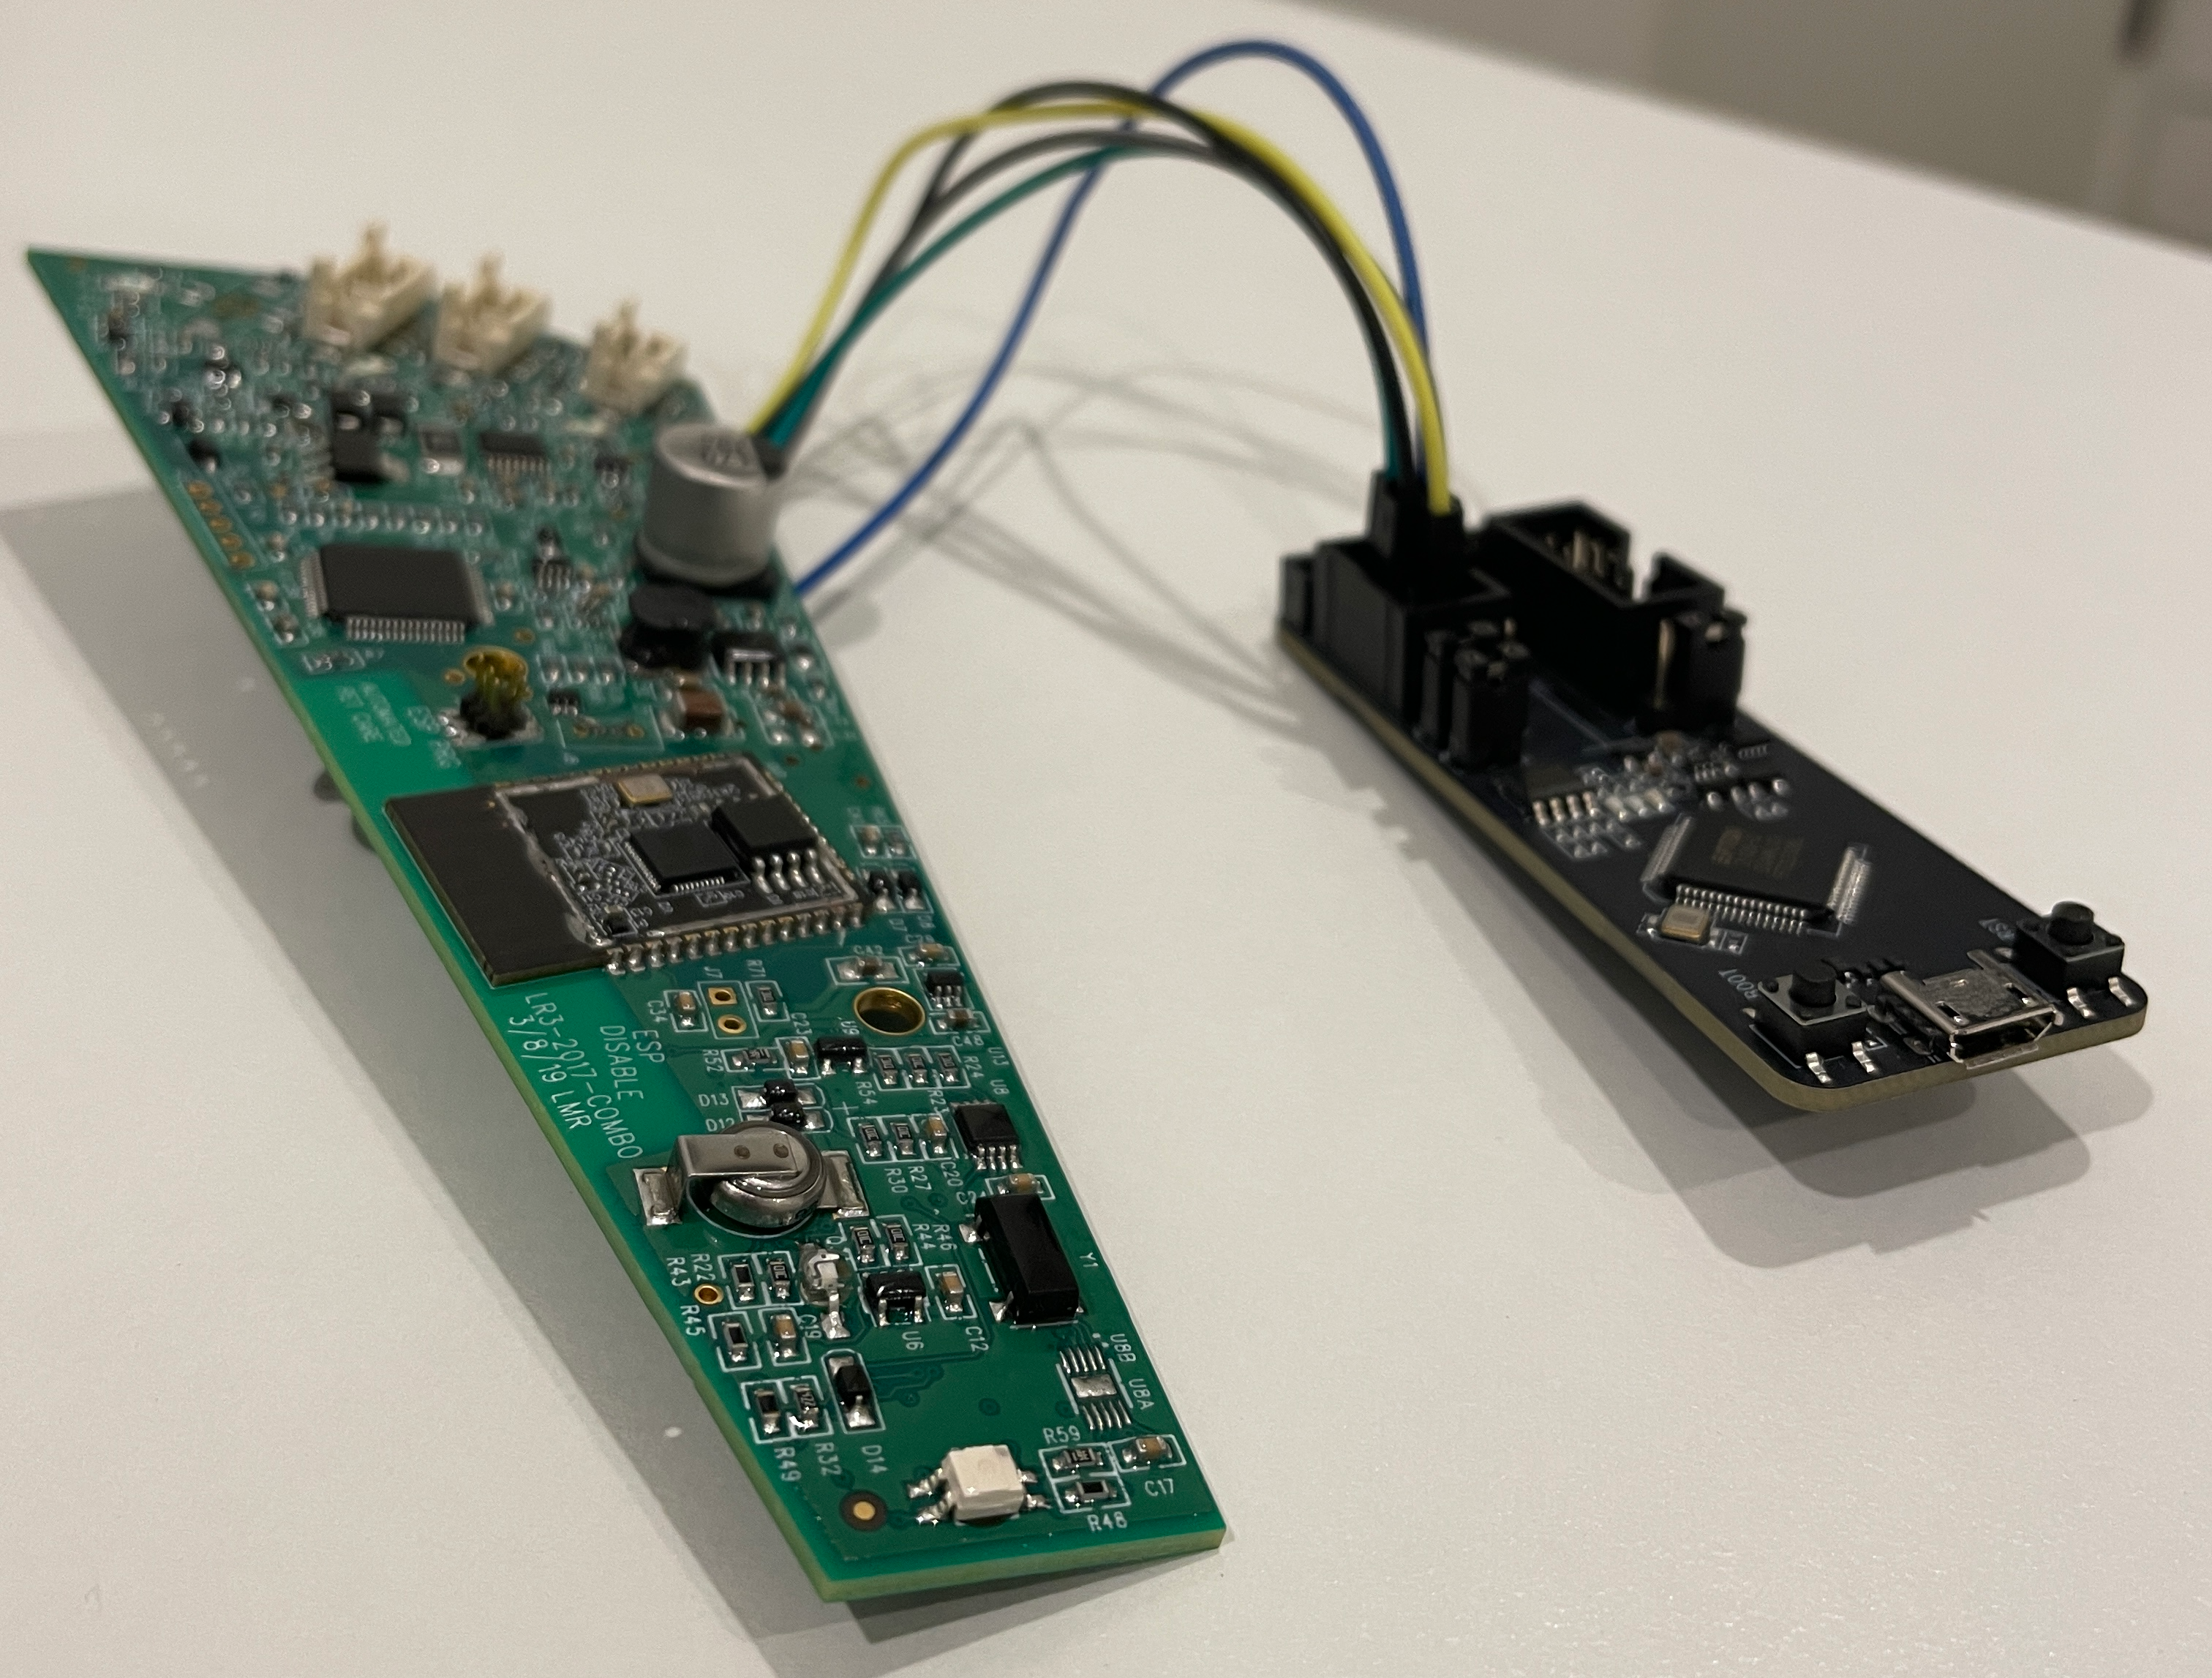
With my fancy new pinouts now connected to the ESP programmer board and then to the computer, I gave the command another whirl.
$ idf_monitor.py --port /dev/ttyUSB1
And……
I (6149) OnboardWifi: Setting WiFi configuration SSID  ...
I (6479) Main: Change State to: 8
I (6479) OnboardWifi: EVENT: 14
I (6479) OnboardWifi: Start SSID scan
I (6479) BTDM_INIT: BT controller compile version [e989f20]
I (6479) OnboardWifi: WiFi Initialized [ssid:][ip:192.168.4.1]
I (6479) system_api: Base MAC address is not set, read default base MAC address from BLK0 of EFUSE
I (6559) OnboardService: listening for onboard request on:2379
I (9639) OnboardWifi: EVENT: 1
I (9639) OnboardWifi: Found: for-robot-1
I (9639) OnboardWifi: Found: for-robot-2
I (9639) OnboardWifi: Found: neighbours-wifi
Boom! We have some debug messages coming through the serial port. Now we can keep track of any interesting things being logged in real time. I was also able to get more info from the board using esptool.py and espfuse.py.
$ esptool.py --port /dev/ttyUSB1 chip_id
esptool.py v3.3.1-dev
Serial port /dev/ttyUSB1
Connecting....
Detecting chip type... ESP32
Chip is ESP32-D0WD (revision 1)
Features: WiFi, BT, Dual Core, 240MHz, VRef calibration in efuse, Coding Scheme None
Crystal is 40MHz
MAC: xx:xx:xx:xx:xx:xx
It’s probably worth noting that it would/should be possible to dump the firmware using esptool.py at this point, however I decided to try out more gadgets first.
Usually I would start with the mobile application and see if there is some kind of firmware updater/downloader in order to get my hands on something to play with, but I decided to go with a static approach first and to try some gadgets that my colleagues sent me to play with. In this case I had my hands on a Dediprog SF100 which is a serial flash programmer, I was told I can just hook these up to the on-board flash chip and dump the contents. So let’s try that.
Step 1: Expose the chip (remove the shield).
Step 2: Attach the clips from the SF100 to the flash pins.
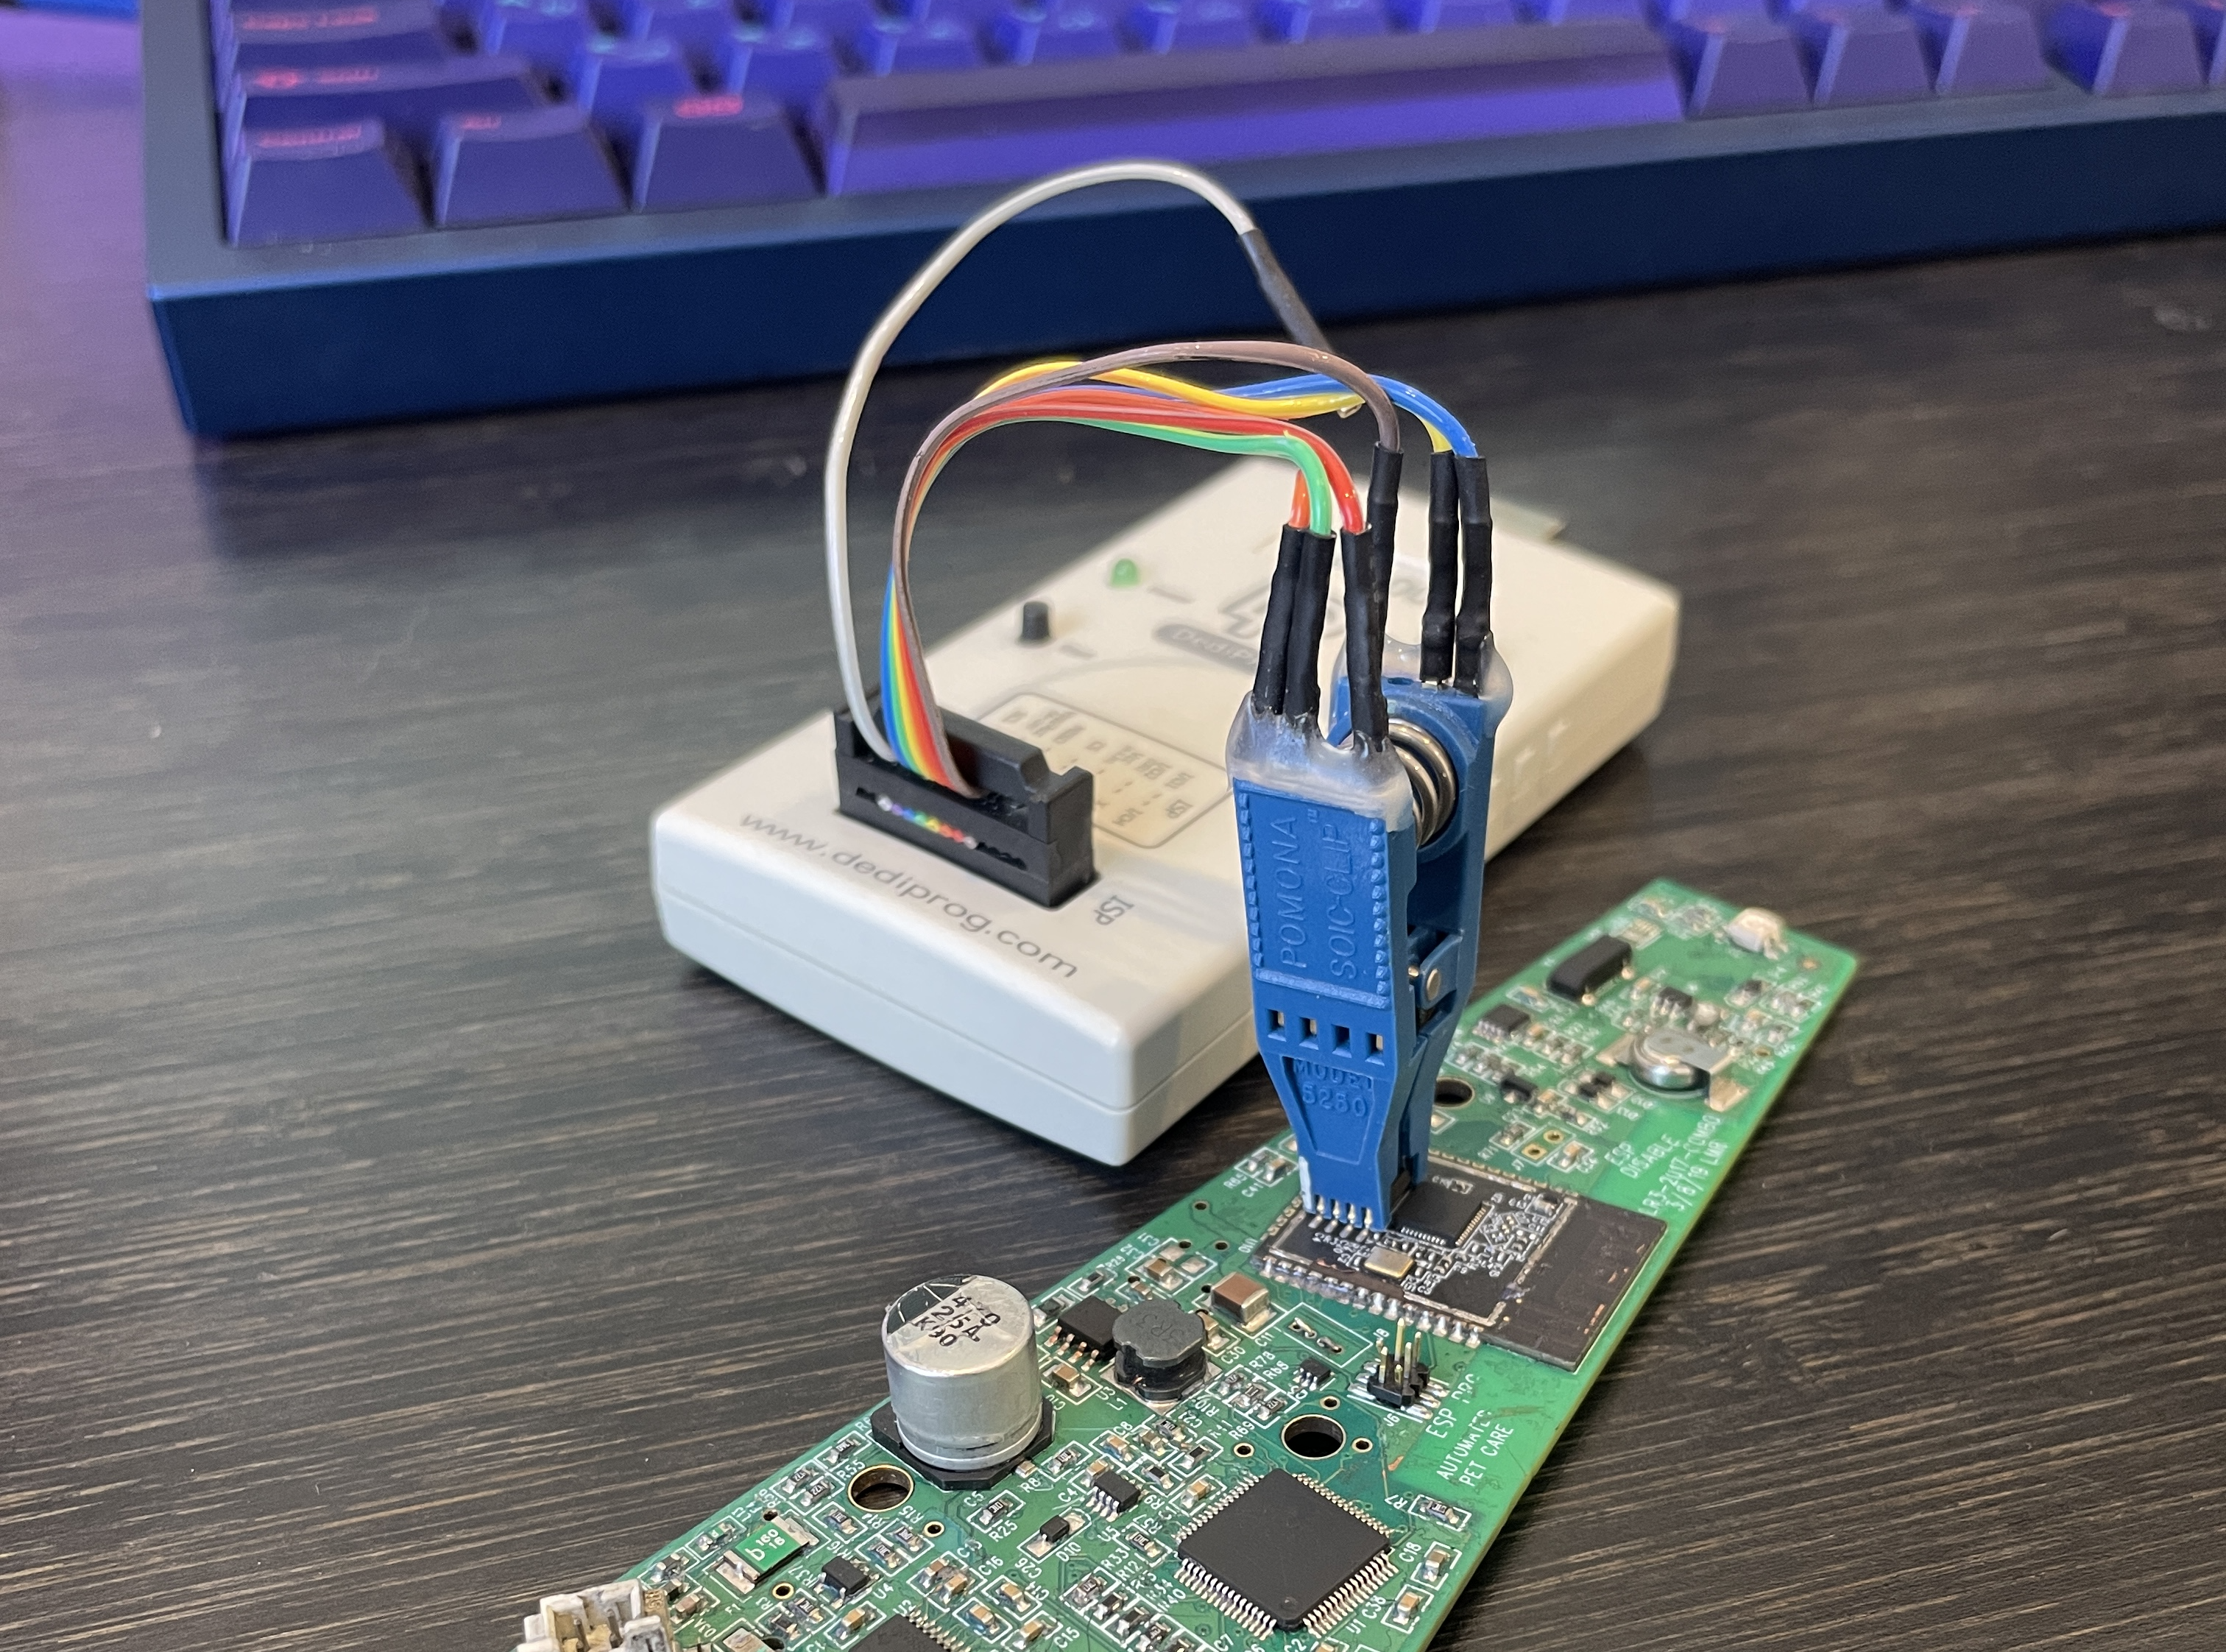
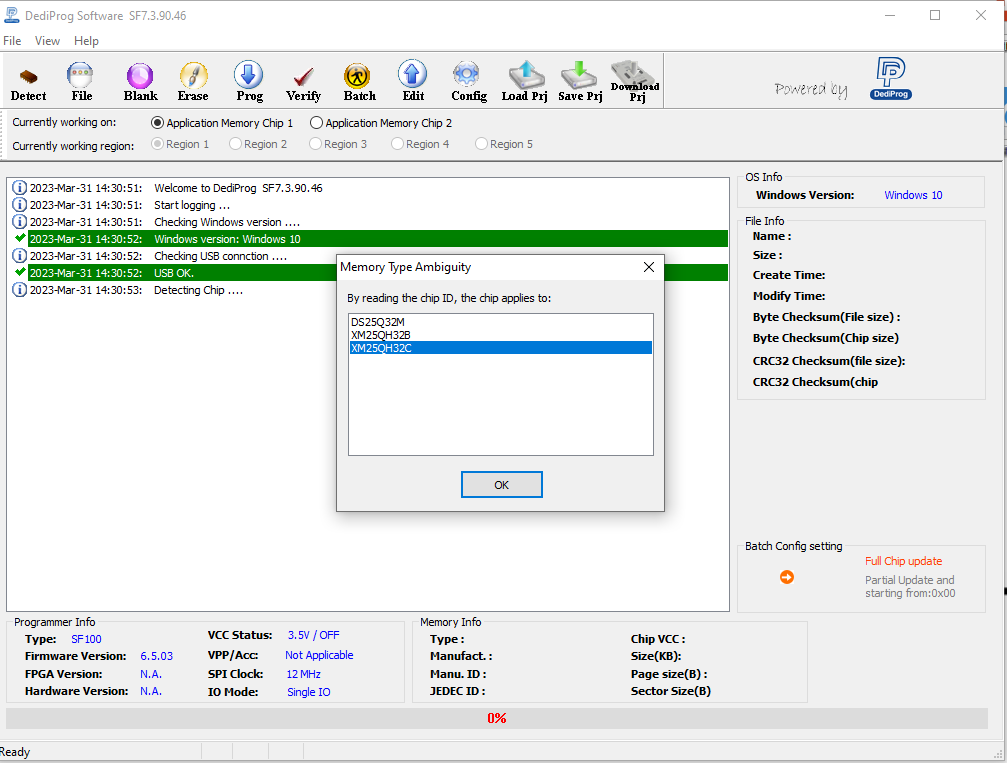
Step 3: Connect via USB and open the DediProg Engineer application.
Here I selected XMC25QH32C as it was the text I could read on the flash chip, might take a bit of squinting to read.
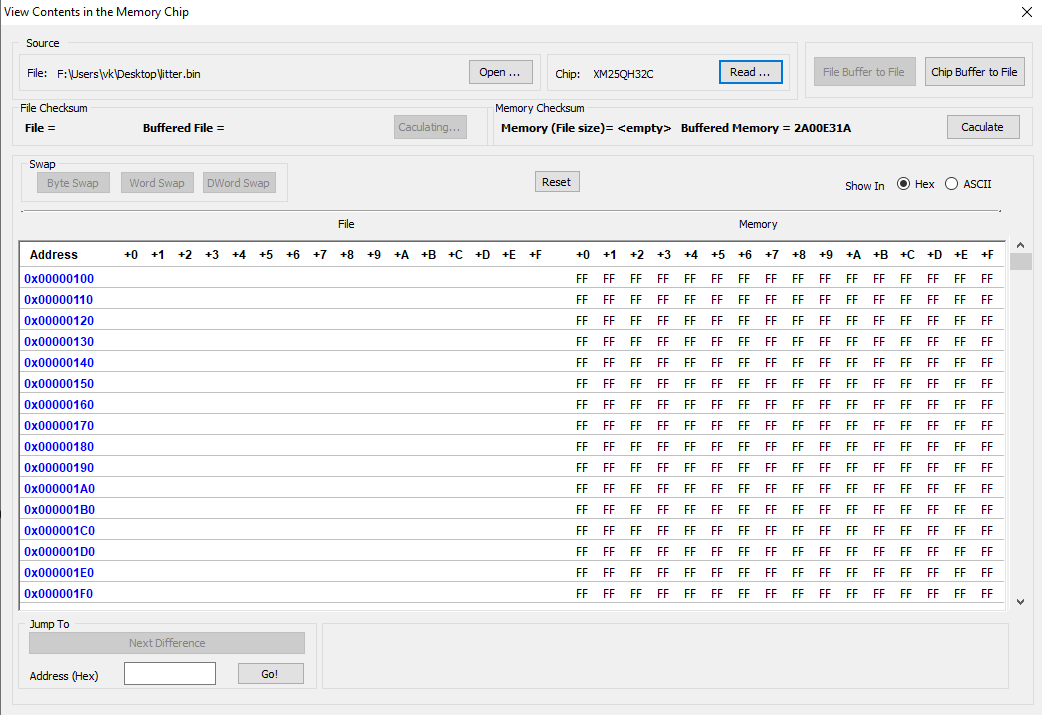
Step 4: Select Edit and Read to extract the contents of the chip.
Selecting Chip buffer to file will allow you to then save the .bin file of the flash memory.
So we’ve got the extracted memory dump, but we need to make sense of the dump. Initially I thought I’d hit it with binwalk to see what would show up, the output was interesting but wasn’t quite what I was looking for.
└─$ binwalk litter.bin
DECIMAL       HEXADECIMAL     DESCRIPTION
--------------------------------------------------------------------------------
8380          0x20BC          Unix path: /home/tdenton/esp/esp-idf/components/bootloader_support/src/bootloader_init.c
9648          0x25B0          Unix path: /home/tdenton/esp/esp-idf/components/bootloader_support/src/bootloader_random.c
10820         0x2A44          Unix path: /home/tdenton/esp/esp-idf/components/soc/esp32/rtc_time.c
65896         0x10168         Unix path: /home/tdenton/esp/esp-idf/components/esp32/cpu_start.c
66924         0x1056C         Unix path: /home/tdenton/esp/esp-idf/components/esp32/crosscore_int.c
67376         0x10730         Unix path: /home/tdenton/esp/esp-idf/components/esp32/esp_timer_esp32.c
67860         0x10914         Unix path: /home/tdenton/esp/esp-idf/components/esp32/ets_timer_legacy.c
71016         0x11568         Unix path: /home/tdenton/esp/esp-idf/components/esp32/reset_reason.c
72084         0x11994         Unix path: /home/tdenton/esp/esp-idf/components/esp32/task_wdt.c
72532         0x11B54         Unix path: /home/tdenton/esp/esp-idf/components/esp32/brownout.c
72748         0x11C2C         Unix path: /home/tdenton/esp/esp-idf/components/esp32/clk.c
78932         0x13454         Unix path: /home/tdenton/esp/esp-idf/components/cxx/cxx_guards.cpp
94984         0x17308         PEM certificate
104208        0x19710         SHA256 hash constants, little endian
105128        0x19AA8         Unix path: /home/tdenton/esp/esp-idf/components/soc/esp32/rtc_time.c
105444        0x19BE4         Unix path: /home/tdenton/esp/esp-idf/components/heap/heap_caps.c
106044        0x19E3C         Unix path: /home/tdenton/esp/esp-idf/components/heap/heap_caps_init.c
106380        0x19F8C         Unix path: /home/tdenton/esp/esp-idf/components/freertos/event_groups.c
106644        0x1A094         Unix path: /home/tdenton/esp/esp-idf/components/freertos/port.c
108044        0x1A60C         Unix path: /home/tdenton/esp/esp-idf/components/freertos/timers.c
108356        0x1A744         Unix path: /home/tdenton/esp/esp-idf/components/newlib/locks.c
152668        0x2545C         Unix path: /home/tdenton/esp/esp-idf/components/soc/src/memory_layout_utils.c
153092        0x25604         Unix path: /home/tdenton/esp/esp-idf/components/vfs/vfs.c
154200        0x25A58         Unix path: /home/tdenton/esp/esp-idf/components/driver/gpio.c
159332        0x26E64         Unix path: /home/tdenton/esp/esp-idf/components/driver/rtc_module.c
162736        0x27BB0         Unix path: /home/tdenton/esp/esp-idf/components/driver/uart.c
170588        0x29A5C         Unix path: /home/tdenton/esp/esp-idf/components/efuse/src/esp_efuse_utility.c
172808        0x2A308         Unix path: /home/tdenton/esp/esp-idf/components/app_update/esp_ota_ops.c
173788        0x2A6DC         Unix path: /home/tdenton/esp/esp-idf/components/spi_flash/cache_utils.c
174496        0x2A9A0         Unix path: /home/tdenton/esp/esp-idf/components/spi_flash/partition.c
178496        0x2B940         Unix path: /home/tdenton/esp/esp-idf/components/nvs_flash/src/nvs_pagemanager.cpp
184376        0x2D038         Unix path: /home/tdenton/esp/esp-idf/components/lwip/lwip/src/core/tcp_in.c
185364        0x2D414         Unix path: /home/tdenton/esp/esp-idf/components/lwip/lwip/src/core/tcp_out.c
186728        0x2D968         Unix path: /home/tdenton/esp/esp-idf/components/lwip/lwip/src/core/udp.c
188724        0x2E134         Unix path: /home/tdenton/esp/esp-idf/components/lwip/lwip/src/core/ipv4/etharp.c
189764        0x2E544         Unix path: /home/tdenton/esp/esp-idf/components/lwip/lwip/src/core/ipv4/igmp.c
191284        0x2EB34         Unix path: /home/tdenton/esp/esp-idf/components/lwip/lwip/src/core/ipv6/ip6_frag.c
191688        0x2ECC8         Unix path: /home/tdenton/esp/esp-idf/components/lwip/lwip/src/core/ipv6/nd6.c
192456        0x2EFC8         Unix path: /home/tdenton/esp/esp-idf/components/lwip/lwip/src/api/api_lib.c
195392        0x2FB40         Unix path: /home/tdenton/esp/esp-idf/components/tcpip_adapter/tcpip_adapter_lwip.c
195812        0x2FCE4         Unix path: /home/tdenton/esp/esp-idf/components/pthread/pthread.c
196160        0x2FE40         Unix path: /home/tdenton/esp/esp-idf/components/pthread/pthread_local_storage.c
196612        0x30004         AES Inverse S-Box
202880        0x31880         Unix path: /home/tdenton/esp/esp-idf/components/bt/bt.c
204520        0x31EE8         Unix path: /home/tdenton/esp/esp-idf/components/bt/bluedroid/btc/core/btc_ble_storage.c
204860        0x3203C         Unix path: /home/tdenton/esp/esp-idf/components/bt/bluedroid/btc/core/btc_config.c
209004        0x3306C         Unix path: /home/tdenton/esp/esp-idf/components/bt/bluedroid/device/bdaddr.c
211180        0x338EC         Unix path: /home/tdenton/esp/esp-idf/components/bt/bluedroid/hci/hci_layer.c
211576        0x33A78         Unix path: /home/tdenton/esp/esp-idf/components/bt/bluedroid/hci/hci_packet_factory.c
212612        0x33E84         Unix path: /home/tdenton/esp/esp-idf/components/bt/bluedroid/hci/packet_fragmenter.c
226972        0x3769C         Unix path: /home/tdenton/esp/esp-idf/components/bt/bluedroid/stack/btu/btu_task.c
254392        0x3E1B8         Unix path: /home/tdenton/esp/esp-idf/components/bt/common/osi/alarm.c
254856        0x3E388         Unix path: /home/tdenton/esp/esp-idf/components/bt/common/osi/config.c
256228        0x3E8E4         Unix path: /home/tdenton/esp/esp-idf/components/bt/common/osi/fixed_queue.c
256800        0x3EB20         Unix path: /home/tdenton/esp/esp-idf/components/bt/common/osi/hash_map.c
260552        0x3F9C8         Unix path: /home/tdenton/esp/esp-idf/components/bt/bluedroid/bta/sys/bta_sys_main.c
261020        0x3FB9C         Unix path: /home/tdenton/esp/esp-idf/components/bt/bluedroid/btc/core/btc_dm.c
264064        0x40780         Unix path: /home/tdenton/esp/esp-idf/components/bt/bluedroid/hci/hci_hal_h4.c
270076        0x41EFC         Unix path: /home/tdenton/esp/esp-idf/components/bt/bluedroid/stack/btm/btm_ble_bgconn.c
272124        0x426FC         AES S-Box
278044        0x43E1C         Unix path: /home/tdenton/esp/esp-idf/components/bt/bluedroid/device/interop.c
278508        0x43FEC         Unix path: /home/tdenton/esp/esp-idf/components/esp_http_client/esp_http_client.c
280760        0x448B8         Unix path: /home/tdenton/esp/esp-idf/components/esp_http_client/lib/http_auth.c
281284        0x44AC4         Unix path: /home/tdenton/esp/esp-idf/components/esp_http_client/lib/http_utils.c
289716        0x46BB4         PEM certificate
291348        0x47214         Base64 standard index table
301028        0x497E4         PEM RSA private key
301092        0x49824         PEM EC private key
309660        0x4B99C         Unix path: /home/tdenton/esp/esp-idf/components/esp_ringbuf/ringbuf.c
310436        0x4BCA4         Unix path: /home/tdenton/esp/esp-idf/components/bootloader_support/src/bootloader_common.c
311520        0x4C0E0         Unix path: /home/tdenton/esp/esp-idf/components/bootloader_support/src/bootloader_sha.c
312724        0x4C594         Unix path: /home/tdenton/esp/esp-idf/components/lwip/lwip/src/api/netdb.c
317116        0x4D6BC         Unix path: /home/tdenton/esp/esp-idf/components/tcp_transport/transport.c
317680        0x4D8F0         Unix path: /home/tdenton/esp/esp-idf/components/tcp_transport/transport_ssl.c
317980        0x4DA1C         Unix path: /home/tdenton/esp/esp-idf/components/tcp_transport/transport_tcp.c
391968        0x5FB20         Unix path: /home/tdenton/esp/esp-idf/components/heap/multi_heap.c
So a quick google on ESP32 dump parsing lead me to the esp32_image_parser.py tool. Using the parser, we are able to view and extract the partition tables from the binary we extracted. The show_partitions argument revealed the following partitions:
$ ./esp32_image_parser.py show_partitions ../litter.bin
reading partition table...
entry 0:
  label      : nvs
  offset     : 0x9000
  length     : 16384
  type       : 1 [DATA]
  sub type   : 2 [WIFI]

entry 1:
  label      : otadata
  offset     : 0xd000
  length     : 8192
  type       : 1 [DATA]
  sub type   : 0 [OTA]

entry 2:
  label      : phy_init
  offset     : 0xf000
  length     : 4096
  type       : 1 [DATA]
  sub type   : 1 [RF]

entry 3:
  label      : ota_0
  offset     : 0x10000
  length     : 1769472
  type       : 0 [APP]
  sub type   : 16 [ota_0]

entry 4:
  label      : ota_1
  offset     : 0x1c0000
  length     : 1769472
  type       : 0 [APP]
  sub type   : 17 [ota_1]

entry 5:
  label      : pic_factory
  offset     : 0x370000
  length     : 180224
  type       : 1 [DATA]
  sub type   : 2 [WIFI]

entry 6:
  label      : pic_ota_1
  offset     : 0x39c000
  length     : 180224
  type       : 1 [DATA]
  sub type   : 2 [WIFI]

entry 7:
  label      : pic_ota_2
  offset     : 0x3c8000
  length     : 180224
  type       : 1 [DATA]
  sub type   : 2 [WIFI]

entry 8:
  label      : system_config
  offset     : 0x3f4000
  length     : 24576
  type       : 1 [DATA]
  sub type   : 2 [WIFI]

entry 9:
  label      : config
  offset     : 0x3fa000
  length     : 24576
  type       : 1 [DATA]
  sub type   : 2 [WIFI]

Done
There’s a lot to digest here, during the project I determined that:
ota_0 was the main application firmware that I was interested in looking at.ota_1 appeared to be some kind of bootloader/updater.pic prefixed sections corresponded to the extra controllers and sensors connected to the device.nvs and config sections, however they did not seem to have anything user controlled at the time.I then attempted to use the create_elf argument to extract only the ota_0 binary but I ran into this error:
$ ./esp32_image_parser.py create_elf ../litter.bin -partition ota_0 -output ../ota_0_out.bin
Dumping partition 'ota_0' to ota_0_out.bin
Unsure what to do with segment: BYTE_ACCESSIBLE, DRAM
Traceback (most recent call last):
  File "./esp32_image_parser.py", line 281, in <module>
    main()
  File "./esp32_image_parser.py", line 264, in main
    image2elf(dump_file, output_file, verbose)
  File "./esp32_image_parser.py", line 159, in image2elf
    size = len(section_data[name]['data'])
KeyError: '.dram0.data'
A quick Google identified another researcher who had run into the same error. The fix made a small change to esp32_image_parser.py.
diff --git a/esp32_image_parser.py b/esp32_image_parser.py
index 6503cf7..d5861a5 100755
--- a/esp32_image_parser.py
+++ b/esp32_image_parser.py
@@ -51,9 +51,9 @@ def image2elf(filename, output_file, verbose=False):     # maps segment names to ELF sections
     section_map = {
-        'DROM'                      : '.flash.rodata',
-        'BYTE_ACCESSIBLE, DRAM, DMA': '.dram0.data',
-        'IROM'                      : '.flash.text',
+        'DROM'                 : '.flash.rodata',
+        'BYTE_ACCESSIBLE, DRAM': '.dram0.data',
+        'IROM'                 : '.flash.text',
         #'RTC_IRAM'                  : '.rtc.text' TODO
     }
I was then able to extract the primary device firmware binary,
$ ./esp32_image_parser.py create_elf ../litter.bin -partition ota_0 -output ../ota_0_out.bin
Dumping partition 'ota_0' to ota_0_out.bin

Writing ELF to ../ota_0_out.bin...
Bonus
I was also able to perform a similar extraction using the espressif/esp-idf tools after a little bit of tweaking to the extracted flash dump. Initially when running the gen_esp32part.py tool I was running into errors, however after a quick read through of the Espressif Partition Tables documentation, we can see that the partition table is located at 0x8000 in the flash.
We can then use dd to strip the first 32768 (0x8000) bytes and verify the partition table using gen_esp32part.py:
$ dd if=./litter.bin of=./litter_stripped.bin skip=32768 bs=1
4161536+0 records in
4161536+0 records out
4161536 bytes (4.2 MB, 4.0 MiB) copied, 7.92567 s, 525 kB/s

$ gen_esp32part.py --flash-size 4MB litter_stripped.bin
Parsing binary partition input...
Verifying table...
# ESP-IDF Partition Table
# Name, Type, SubType, Offset, Size, Flags
nvs,data,nvs,0x9000,16K,
otadata,data,ota,0xd000,8K,
phy_init,data,phy,0xf000,4K,
ota_0,app,ota_0,0x10000,1728K,
ota_1,app,ota_1,0x1c0000,1728K,
pic_factory,data,nvs,0x370000,176K,
pic_ota_1,data,nvs,0x39c000,176K,
pic_ota_2,data,nvs,0x3c8000,176K,
system_config,data,nvs,0x3f4000,24K,
config,data,nvs,0x3fa000,24K,
The first thing to note is that the ESP32 firmware instructions were in the Xtensa architecture format. At the time of research, the plugins for various disassemblers was quite limited. So naturally I used them all, at the same time, side by side.
A few notes before I continue:
Ghidra plugin that I used can be located here Ebiroll/ghidra-xtensa.Binary Ninja plugin that I used is here zackorndorff/binja-xtensa.cutter (cutter.re) to naturally have a pretty good view of the firmware without plugins.Hopper Disassembler however it didn’t play too nice.My goal was to basically identify how the device handles on-boarding, communication with the API and network traffic.
A quick first pass of the identified strings in Ghidra revealed usage of the AWS iOT SDK:
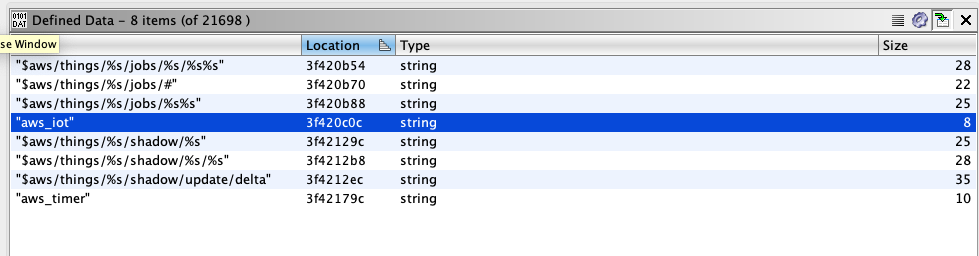
This was important as it indicates that the device will be enrolled and communicate with the AWS IoT core cloud service, a further look into this can be seen further down in the mobile application review.
Another interesting string identified suggested some form of configuration (which I’ll go into a bit further down too):
"Type,SSID,Password,Dispatch,Port,Web,Type,Id,CRC,Serial,endpoint,cloud,lr3\r\n", 0 ; DATA XREF=0x400d0f34
In cutter I was able to see that this string was being used in the Onboarding methods.
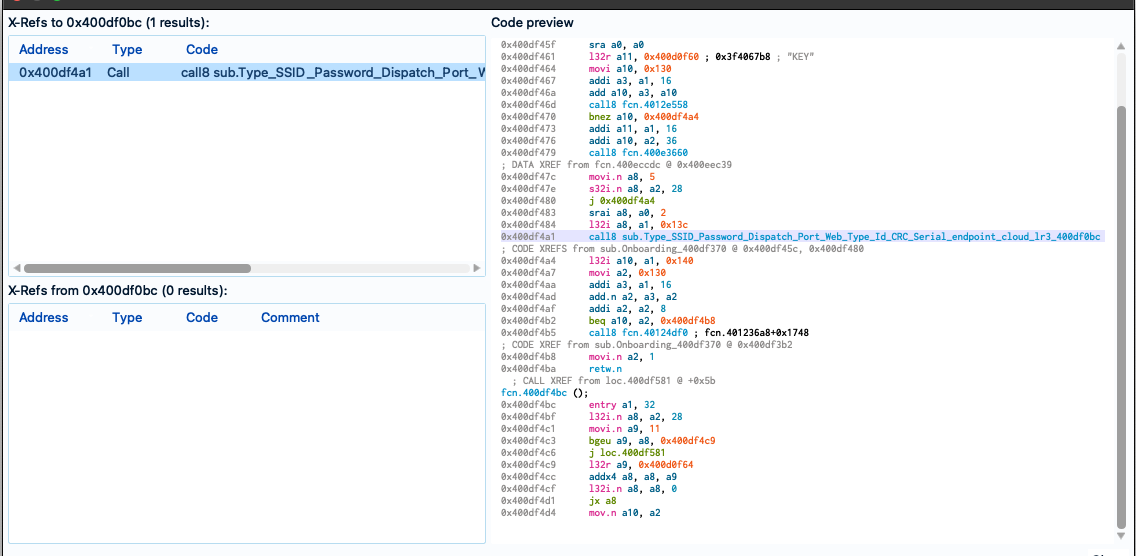
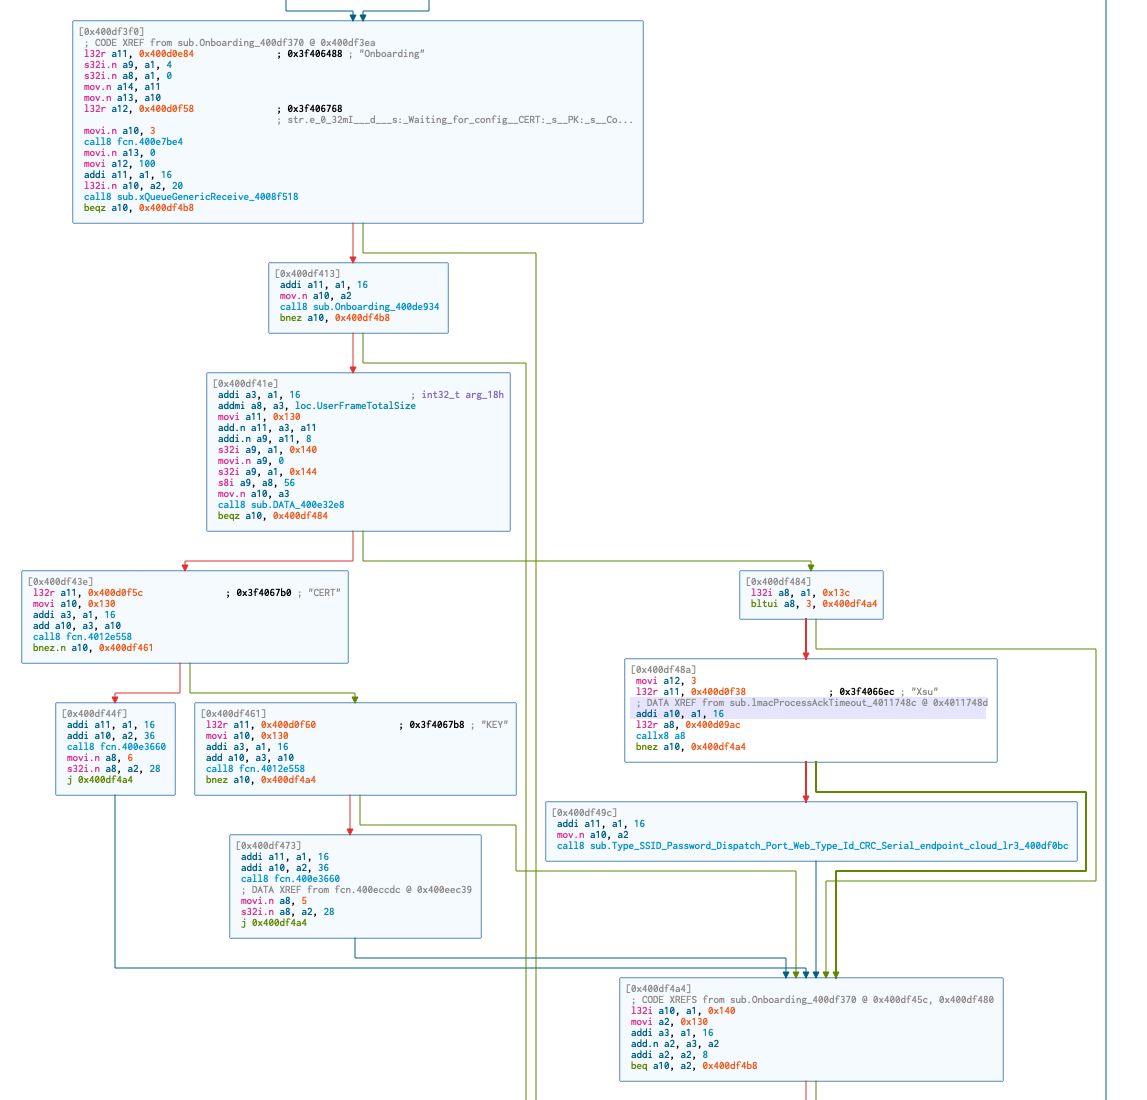
I was also able to visualise several sections of the on-boarding flow such as the following, where we can now see that each element of the on-boarding configuration is checked.
Lastly, I was interested in the communication protocol between the Mobile Application, AWS IoT Instance and the device itself. Trawling through Github I found various projects where researchers had translated the MQTT messages. One project in particular was mbafford/litter-robot-to-mqtt, the researcher mbafford has created a MITM proxy to intercept and view the outgoing and incoming messages to the device, however explains that the device will not accept incoming messages without a valid checksum attached. I was hoping to identify the code responsible for the checksum, however I wasn’t successful during this stint.
The other thing worth mentioning here is that the time of mbafford, it appears that the Litter Robot was using a self hosted MQTT broker. The change to the AWS IoT framework meant that the communication to the server was now encrypted via TLS and I was no longer able to intercept the traffic without replacing the server certificates on the device.
It was clear that the dispatch commands were handled by the firmware:
For clean-up I began by attempting to map the sections and segments first. I found that some of the scripts within Ghidra mentioned loading of ‘SVD’ files, so a quick google resulted in the ehntoo/binaryninja-svd plugin. However when I attempted to load the ESP32 SVD files I found here, I kept getting crashes and issues within Binary Ninja and the plugin itself.
As it turns out, the ESP32 SVD appears to have multiple addressBlock entries per peripheral, this was mentioned in an older issue. I managed to fix up this plugin (PR14) using an updated SVD parser script at stm32-rs/svdtools.
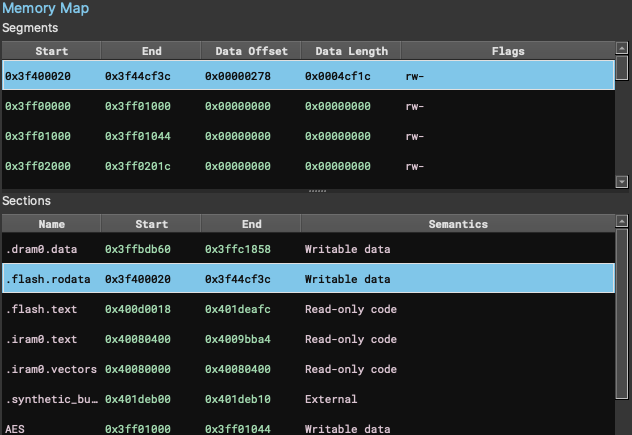
This allowed me to have the correct segments and sections mapped within Binary Ninja, a quick ‘reanalysis’ and things became a little clearer.
The next step was to better define some of the functions, now this was tricky because Binary Ninja seems to do funky stuff when it comes to defining functions, you can’t actually define the start and end… I did two things here, first of all I found this article by apriorit which mentions the entry a1, xx instruction, they said:
This instruction translates into byte sequences such as 36 41 00 / 36 61 00 / 36 81 00 depending on the value of the XX argument.
So I tested out some theories using the binaryview API and came up with the following dirty snippets:
meow = list(bv.find_all_data(bv.start, bv.end,b"\x36\x81\x00"))
bv.begin_undo_actions()
for addr in meow:
  if len(bv.get_functions_containing(addr[0])) == 0:
    bv.create_user_function(addr[0])
    bv.update_analysis_and_wait()
bv.commit_undo_actions()
I repeated this for the other sequences which led to around ~7,000 functions being defined. The other thing I noticed was that Cutter had actually defined a lot more functions that appeared to be pretty accurate, so naturally I dumped that list of addresses too and ran it through the function above too.
Strings were next, there were a couple of clear patterns that were a bit unusual in the firmware, one of those being the logger strings starting with \x1b. Binary Ninja didn’t really like this, so once again, small little snippet to define those structures too.
meow = list(bv.find_all_data(bv.start, bv.end,b"\x1b\x5b\x30\x3b"))
for addr in meow:
  bv.define_user_data_var(addr[0],Type.array(Type.char(),bv.get_ascii_string_at(addr[0]).length))
Resulting in:
It was also possible to define a lot of the JSON strings with the pattern \x00\x7b\x22, there’s a bit too much to show there though.
Before I could continue, I also noticed some very strange behaviour in the Binary Ninja Xtensa Plugin. For example, you can see in this image that some addresses appeared to be mapped twice and the RETW and RETW.N instructions were not being handled correctly:
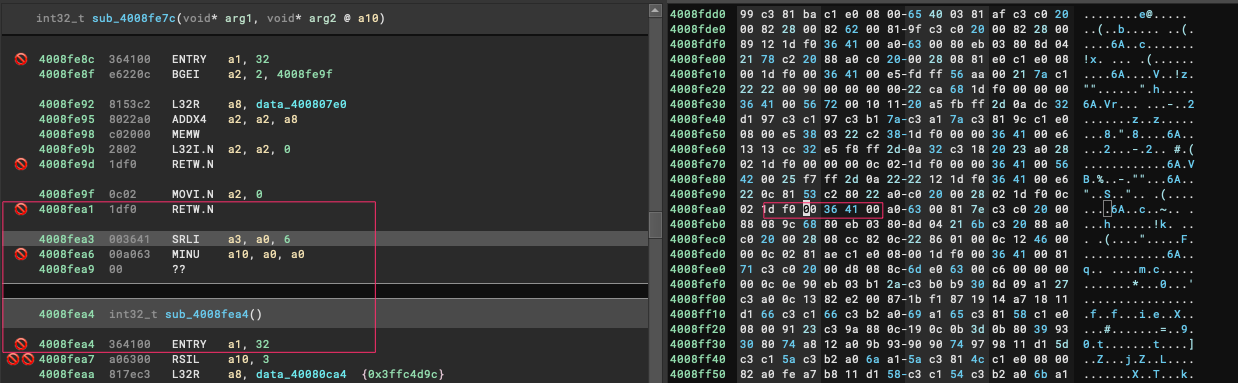
I had to make a couple of changes to the plugin (PR2) to clean this up, resulting in the correct end/start of functions (mostly).
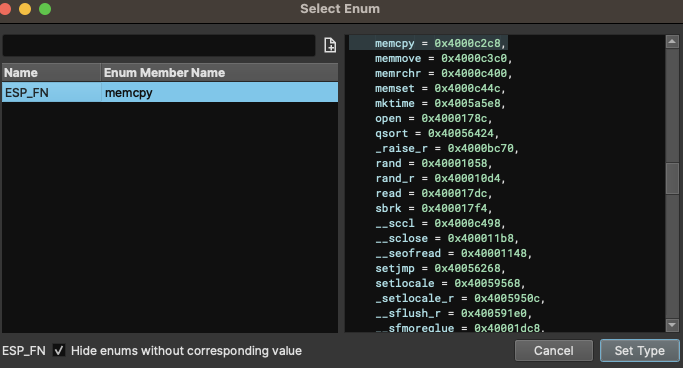
The last little trick I found (and I’m sure there is probably a better way to implement this), as mentioned in the apriorit article above, there are also calls to low-level API functions in the IROM part of the CPU. As it’s been explained well in the article, I won’t go into too much detail, however a quick trick to have some visibility within Binary Ninja is to:
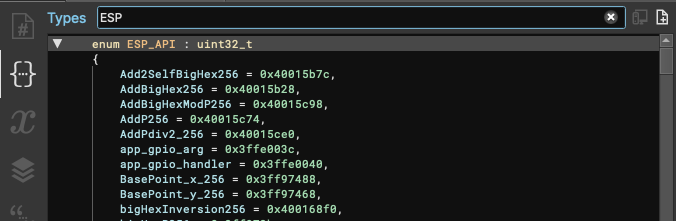
ESP32 ROM address table files from espressif/esp-idf.enum format.Create new types....enum into the text area and hit Create.You should have something similar to this:
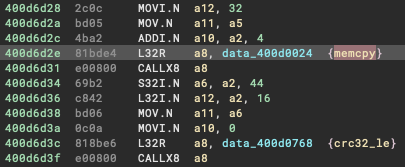
Now when you located an instruction calling a function outside of the range such as these:
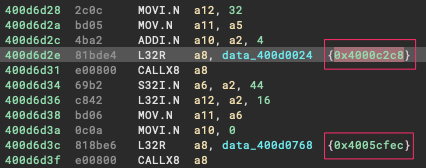
You are able to select the address, hit the M key and choose the matched API value:
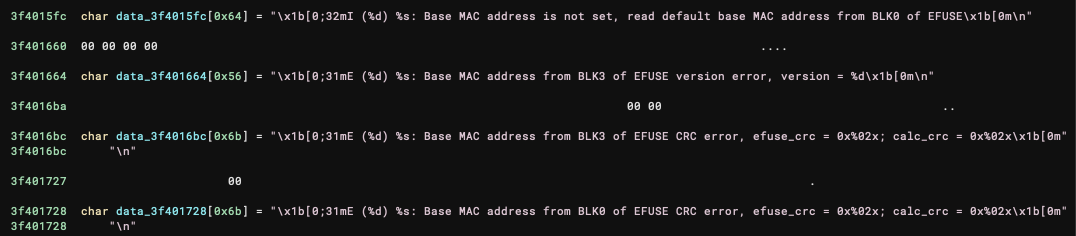
And your assembly view should now look like this (I believe this code handles the CRC checks within the config partition of the flash dump):
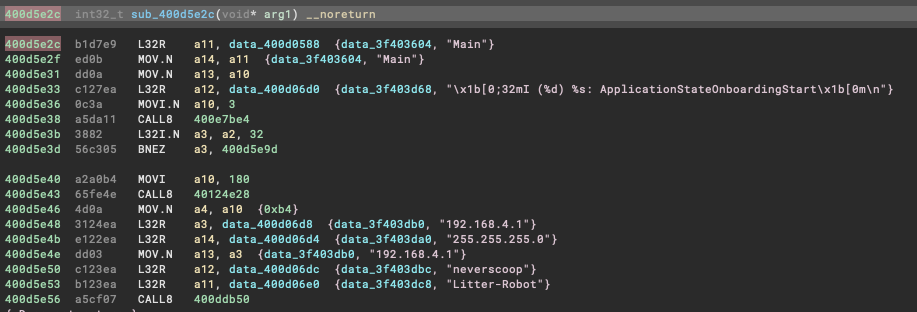
Pretty cool, I know… anyway, unfortunately I haven’t got much more to show you on the reversing side, I hope some of this proves to be useful for those of you that have made it this far. Ultimately it allowed me to have areas of code that were quite readable, such as the on-boarding configuration routine you can see here:
What I wanted to do was capture the traffic that was sent from my phone to the device during on-boarding. To understand how the device is configured, but also to hopefully open up new avenues to configure and flash the device. For example, can we integrate the device completely offline and have it configured without using the application? Or, perhaps we can flash the firmware without connecting to the hardware? Both of these questions, will be partly answered here, and I hope this article opens up further exploration to achieve these goals.
The first step was achieving a reliable way to capture the traffic between the two devices. Understanding the flow during the configuration phase was important, it goes like this (roughly):
litter-robot with the password neverscoop.litter-robot network and opens the Whisker app.Because the device broadcasts it’s own network during on-boarding, I thought of a pretty scuffed idea to capture this traffic, behold:
litter-robot wireless network.laptop-robot.litter-robot network reachable when connected to the laptop-robot network and configure Wireshark or other packet capture software.laptop-robot and begins the on-boarding process.There is probably a cleaner way to do this, but it worked, I was able to start seeing the traffic sent from the mobile mobile app to the device and vice versa. The Litter Robot communicates over UDP, therefore there was a lot of noise initially, however it only took a few minutes to identify the communication stream between the mobile app and the device.
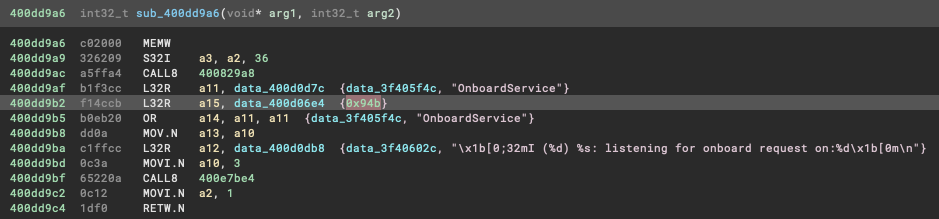
The mobile app was communicating to the device on port 2379 and was receiving the responses on port 2380. I was able to verify this inside Binary Ninja by searching for the hex representation of 2379 (0x94b), as you can see here it looks like we are on target:
Loading the capture into Wireshark allowed for a quick ASCII based view of the UDP conversation:
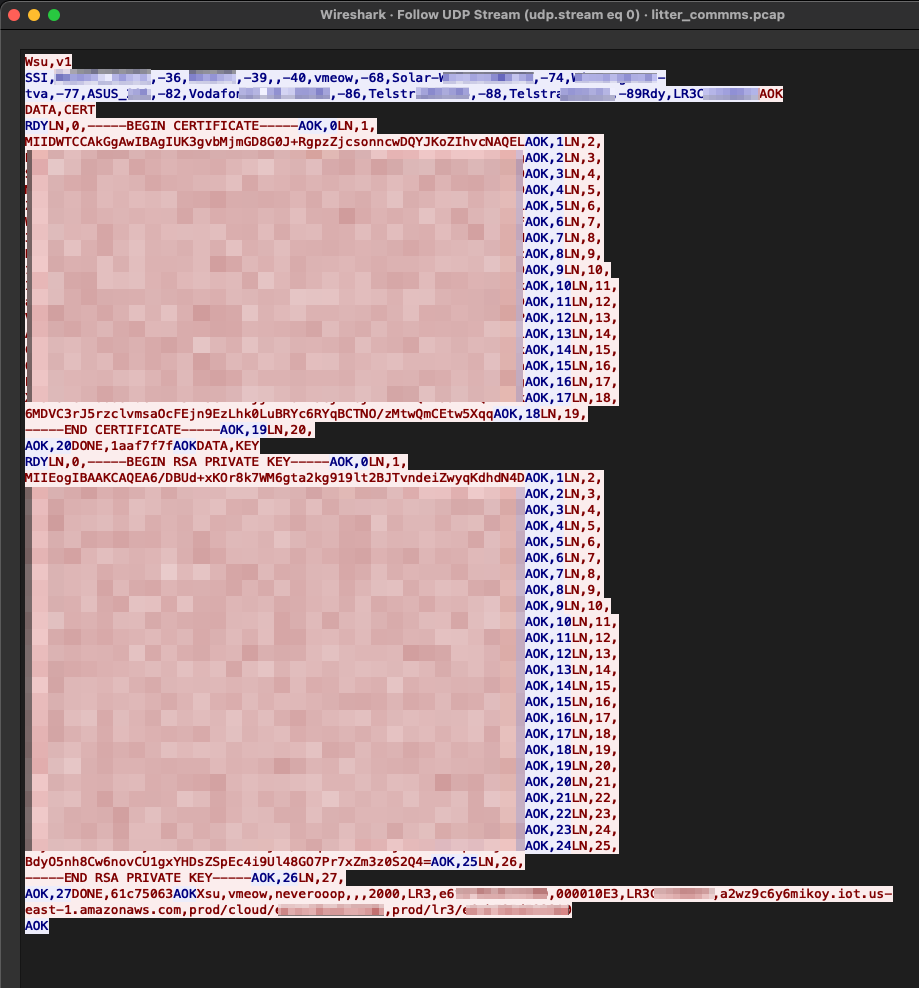
Deconstruction of this message is as follows:
Wsu,v1 and the device responds with a list of wireless networks that it can see (this is then reflected in the mobile app when choosing desired network to join).Rdy,LR3{ID} indicating it’s ready for the next message and including the device ID.AOK to acknowledge the device state and then indicates that it will begin sending a certificate with DATA,CERT.RDY and is now expecting the mobile app to send the certificate line by line.LN, {line number} prefix and the device responds with AOK, {line number}.DONE, 1aaf7f7f (CRC-32 of the final entire message).The steps are repeated for the certificate key until we reach the final message. The message includes the wireless network name and password I gave it, as well as some AWS IOT endpoints and details that we can see in the mobile analysis further down. You will notice that the string I mentioned earlier in the firmware appears to be the header values for this message:
"Type,SSID,Password,Dispatch,Port,Web,Type,Id,CRC,Serial,endpoint,cloud,lr3\r\n", 0 ; DATA XREF=0x400d0f34
What was the purpose of this you ask? Well, I was able to replicate this on-boarding process using just scapy, we can also manipulate the values, for example the endpoints, ports, etc. However I stopped there as the communication expected a TLS connection, this may help others though.
sr1(IP(dst='192.168.4.1')/UDP(sport=2380,dport=2379)/Raw(load='Wsu,v1\r\n'),iface='en0')
send(IP(dst='192.168.4.1')/UDP(sport=2380,dport=2379)/Raw(load='AOK\r\n'),iface='en0')
sr1(IP(dst='192.168.4.1')/UDP(sport=2380,dport=2379)/Raw(load='DATA,CERT\r\n'),iface='en0')
sr1(IP(dst='192.168.4.1')/UDP(sport=2380,dport=2379)/Raw(load='LN,0,-----BEGIN CERTIFICATE-----'),iface='en0')
sr1(IP(dst='192.168.4.1')/UDP(sport=2380,dport=2379)/Raw(load='LN,1\nREDACTED'),iface='en0')
sr1(IP(dst='192.168.4.1')/UDP(sport=2380,dport=2379)/Raw(load='LN,2\nREDACTED'),iface='en0')
sr1(IP(dst='192.168.4.1')/UDP(sport=2380,dport=2379)/Raw(load='LN,3\nREDACTED'),iface='en0')
sr1(IP(dst='192.168.4.1')/UDP(sport=2380,dport=2379)/Raw(load='LN,4\nREDACTED'),iface='en0')
sr1(IP(dst='192.168.4.1')/UDP(sport=2380,dport=2379)/Raw(load='LN,5\nREDACTED'),iface='en0')
sr1(IP(dst='192.168.4.1')/UDP(sport=2380,dport=2379)/Raw(load='LN,6\nREDACTED'),iface='en0')
sr1(IP(dst='192.168.4.1')/UDP(sport=2380,dport=2379)/Raw(load='LN,7\nREDACTED'),iface='en0')
sr1(IP(dst='192.168.4.1')/UDP(sport=2380,dport=2379)/Raw(load='LN,8\nREDACTED'),iface='en0')
sr1(IP(dst='192.168.4.1')/UDP(sport=2380,dport=2379)/Raw(load='LN,9\nREDACTED'),iface='en0')
sr1(IP(dst='192.168.4.1')/UDP(sport=2380,dport=2379)/Raw(load='LN,10\nREDACTED'),iface='en0')
sr1(IP(dst='192.168.4.1')/UDP(sport=2380,dport=2379)/Raw(load='LN,11\nREDACTED'),iface='en0')
sr1(IP(dst='192.168.4.1')/UDP(sport=2380,dport=2379)/Raw(load='LN,12\nREDACTED'),iface='en0')
sr1(IP(dst='192.168.4.1')/UDP(sport=2380,dport=2379)/Raw(load='LN,13\nREDACTED'),iface='en0')
sr1(IP(dst='192.168.4.1')/UDP(sport=2380,dport=2379)/Raw(load='LN,14\nREDACTED'),iface='en0')
sr1(IP(dst='192.168.4.1')/UDP(sport=2380,dport=2379)/Raw(load='LN,15\nREDACTED'),iface='en0')
sr1(IP(dst='192.168.4.1')/UDP(sport=2380,dport=2379)/Raw(load='LN,16\nREDACTED'),iface='en0')
sr1(IP(dst='192.168.4.1')/UDP(sport=2380,dport=2379)/Raw(load='LN,17\nREDACTED'),iface='en0')
sr1(IP(dst='192.168.4.1')/UDP(sport=2380,dport=2379)/Raw(load='LN,18\nREDACTED'),iface='en0')
sr1(IP(dst='192.168.4.1')/UDP(sport=2380,dport=2379)/Raw(load='LN,19,\n-----END CERTIFICATE-----'),iface='en0')
sr1(IP(dst='192.168.4.1')/UDP(sport=2380,dport=2379)/Raw(load='LN,20,\n'),iface='en0')
sr1(IP(dst='192.168.4.1')/UDP(sport=2380,dport=2379)/Raw(load='DONE,1aaf7f7f'),iface='en0')
sr1(IP(dst='192.168.4.1')/UDP(sport=2380,dport=2379)/Raw(load='DATA,KEY\r\n'),iface='en0')
sr1(IP(dst='192.168.4.1')/UDP(sport=2380,dport=2379)/Raw(load='LN,0,-----BEGIN RSA PRIVATE KEY-----'),iface='en0')
sr1(IP(dst='192.168.4.1')/UDP(sport=2380,dport=2379)/Raw(load='LN,1\nREDACTED'),iface='en0')
sr1(IP(dst='192.168.4.1')/UDP(sport=2380,dport=2379)/Raw(load='LN,2\nREDACTED'),iface='en0')
sr1(IP(dst='192.168.4.1')/UDP(sport=2380,dport=2379)/Raw(load='LN,3\nREDACTED'),iface='en0')
sr1(IP(dst='192.168.4.1')/UDP(sport=2380,dport=2379)/Raw(load='LN,4\nREDACTED'),iface='en0')
sr1(IP(dst='192.168.4.1')/UDP(sport=2380,dport=2379)/Raw(load='LN,5\nREDACTED'),iface='en0')
sr1(IP(dst='192.168.4.1')/UDP(sport=2380,dport=2379)/Raw(load='LN,6\nREDACTED'),iface='en0')
sr1(IP(dst='192.168.4.1')/UDP(sport=2380,dport=2379)/Raw(load='LN,7\nREDACTED'),iface='en0')
sr1(IP(dst='192.168.4.1')/UDP(sport=2380,dport=2379)/Raw(load='LN,8\nREDACTED'),iface='en0')
sr1(IP(dst='192.168.4.1')/UDP(sport=2380,dport=2379)/Raw(load='LN,9\nREDACTED'),iface='en0')
sr1(IP(dst='192.168.4.1')/UDP(sport=2380,dport=2379)/Raw(load='LN,10\nREDACTED'),iface='en0')
sr1(IP(dst='192.168.4.1')/UDP(sport=2380,dport=2379)/Raw(load='LN,11\nREDACTED'),iface='en0')
sr1(IP(dst='192.168.4.1')/UDP(sport=2380,dport=2379)/Raw(load='LN,12\nREDACTED'),iface='en0')
sr1(IP(dst='192.168.4.1')/UDP(sport=2380,dport=2379)/Raw(load='LN,13\nREDACTED'),iface='en0')
sr1(IP(dst='192.168.4.1')/UDP(sport=2380,dport=2379)/Raw(load='LN,14\nREDACTED'),iface='en0')
sr1(IP(dst='192.168.4.1')/UDP(sport=2380,dport=2379)/Raw(load='LN,15\nREDACTED'),iface='en0')
sr1(IP(dst='192.168.4.1')/UDP(sport=2380,dport=2379)/Raw(load='LN,16\nREDACTED'),iface='en0')
sr1(IP(dst='192.168.4.1')/UDP(sport=2380,dport=2379)/Raw(load='LN,17\nREDACTED'),iface='en0')
sr1(IP(dst='192.168.4.1')/UDP(sport=2380,dport=2379)/Raw(load='LN,18\nREDACTED'),iface='en0')
sr1(IP(dst='192.168.4.1')/UDP(sport=2380,dport=2379)/Raw(load='LN,19\nREDACTED'),iface='en0')
sr1(IP(dst='192.168.4.1')/UDP(sport=2380,dport=2379)/Raw(load='LN,20\nREDACTED'),iface='en0')
sr1(IP(dst='192.168.4.1')/UDP(sport=2380,dport=2379)/Raw(load='LN,21\nREDACTED'),iface='en0')
sr1(IP(dst='192.168.4.1')/UDP(sport=2380,dport=2379)/Raw(load='LN,22\nREDACTED'),iface='en0')
sr1(IP(dst='192.168.4.1')/UDP(sport=2380,dport=2379)/Raw(load='LN,23\nREDACTED'),iface='en0')
sr1(IP(dst='192.168.4.1')/UDP(sport=2380,dport=2379)/Raw(load='LN,24\nREDACTED'),iface='en0')
sr1(IP(dst='192.168.4.1')/UDP(sport=2380,dport=2379)/Raw(load='LN,25\nREDACTED'),iface='en0')
sr1(IP(dst='192.168.4.1')/UDP(sport=2380,dport=2379)/Raw(load='LN,26,\n-----END RSA PRIVATE KEY-----'),iface='en0')
sr1(IP(dst='192.168.4.1')/UDP(sport=2380,dport=2379)/Raw(load='LN,27,\n'),iface='en0')
sr1(IP(dst='192.168.4.1')/UDP(sport=2380,dport=2379)/Raw(load='DONE,61c75063'),iface='en0')
sr1(IP(dst='192.168.4.1')/UDP(sport=2380,dport=2379)/Raw(load='Xsu,meowfi-cat,neverscoop,,,2000,LR3,REDACTED,000010E3,LR3REDACTED,a2wz9c6y6mikoy.iot.us-east-1.amazonaws.com,prod/cloud/REDACTED,prod/lr3/REDACTED\r\n'),iface='en0')
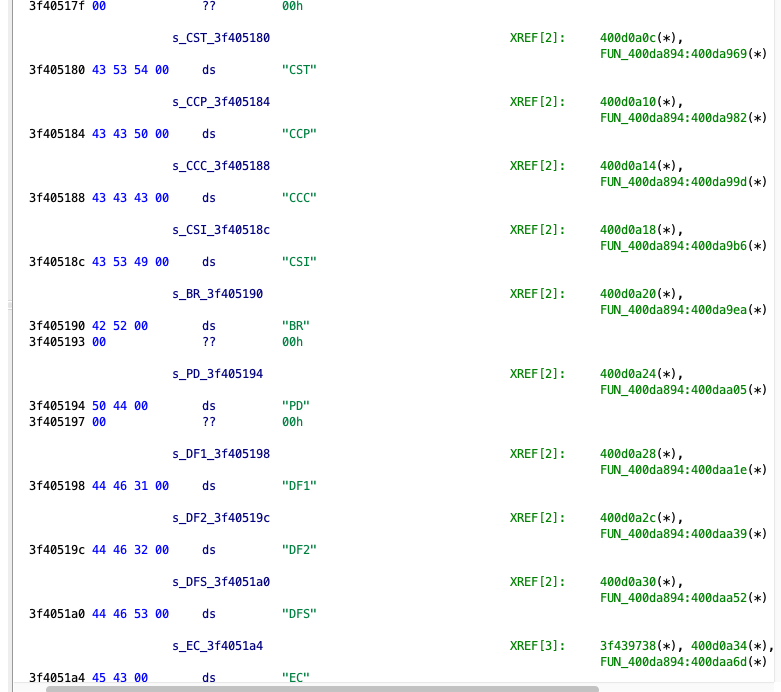
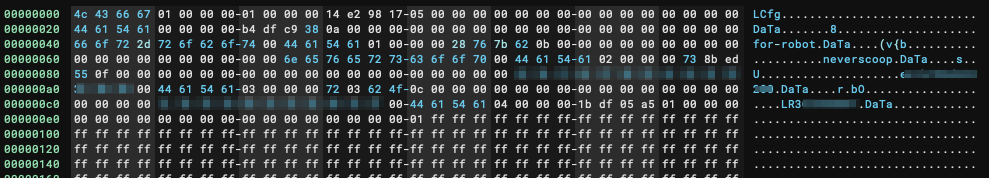
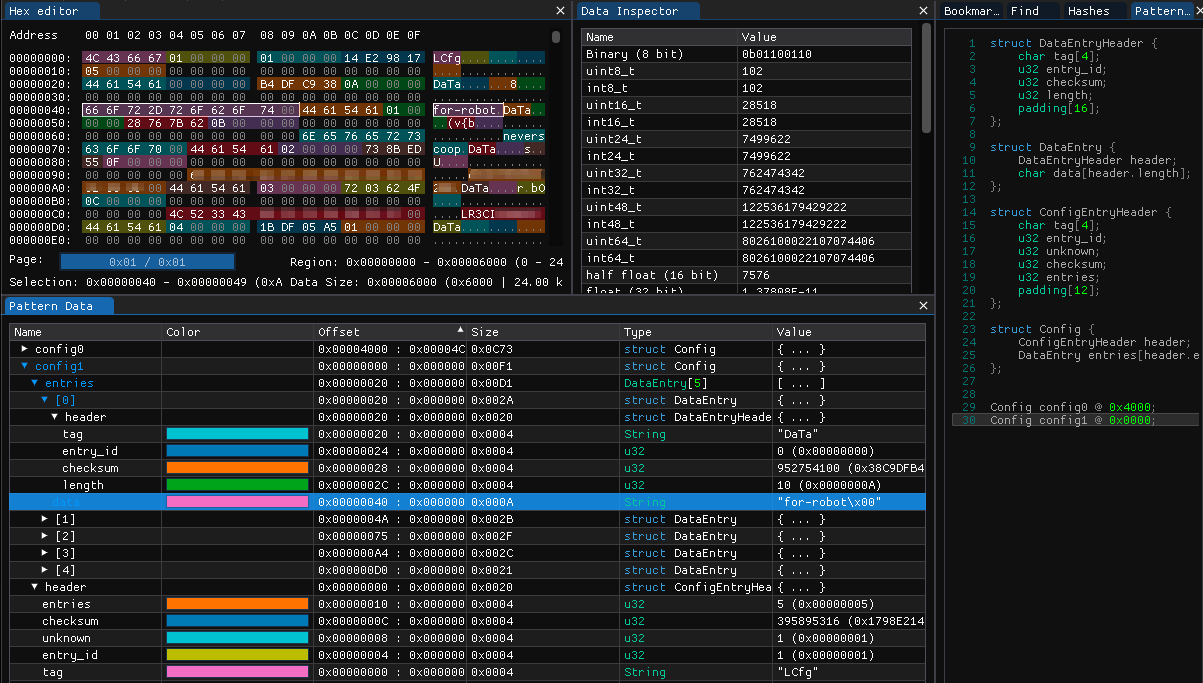
It’s also worth pointing out that at this point, I took a little step back, and remembered the config partition from the firmware dump I looked at earlier, initially it looked like this:
With a little bit of massaging, it was possible to create an ImHex pattern that would group the values into a more logical view, we can now see each stored data item, the value and the CRC32_le hash stored for each value:
This is the final piece of the Litter Robot universe that I had a poke at during this review. I didn’t want to spend too much time on the mobile applications as the intention was to learn the various other areas of reverse engineering… however, famous last words, I got sucked into the world of ‘Flutter’.
I won’t go into too much detail on Flutter as there are various resources already out there, but to put it into a nutshell, Flutter is a mobile development framework that is able to build releases across all mobile platforms (ios & Android). The coding language itself is ‘Dart’ and is compiled natively.
There is an excellent mini series on reverse engineering Flutter over at Guardsquare, in the article the main pain points have been highlighted:
- The Dart AOT snapshot format is changing a lot with each update.
- All Dart frameworks are statically linked in the application binary.
- The Dart code relies on the Dart VM to be executed.
I highly recommend reading the article mentioned above, I went through the series and attempted to clean up the dissasembly as described but there is still a lot more work to be done there. Anyway, in this section I will briefly go over the steps taken to begin looking at the iOS application, and then some insights and HTTP traffic analysis served with a sneaky vulnerability (that may need to be published later sorry).
Some pre-requisites:
First things first, we need to extract the application IPA file, let’s start by grabbing the common name of the app:
$ frida-ps -Uai | grep whisker
 - Whisker com.whisker.ios
Next up I used frida-ios-dump and iproxy to extract the IPA file.
iproxy to listen on local port 2222. This will route traffic from USB SSH port 44 of the iOS device.$ iproxy 2222 44
Creating listening port 2222 for device port 44
waiting for connection
frida-ios-dump, extract the IPA with the common name identified earlier.$ python3 dump.py com.whisker.ios
Start the target app com.whisker.ios
Dumping Whisker to /var/folders/v6/csfxy4796zxbm470n7fncqhm0000gn/T
[frida-ios-dump]: Load protobuf.framework success.
[...]
start dump /private/var/containers/Bundle/Application/B4995A55-B22B-4243-81D8-D7CD02CC777B/Runner.app/Runner
Runner.fid: 100%|███████████████████████████████████████████████████████████████████████████████████████████████████████████████████████| 1.38M/1.38M [00:00<00:00, 3.08MB/s]
[...]
Generating "Whisker.ipa"
Awesome, now I’ll save you some time and reveal that the mobile app is written in Flutter (woo, not really). The best way I found to get a little deeper for this particular mobile app was using reFlutter. It will patch the IPA file itself to dump the classes, functions and fields at runtime of the app. Using the tool is simply, simply run:
$ reflutter Whisker.ipa
You’ll then want to install the newly patched IPA back on to the phone via your method of choice (I used Filza).
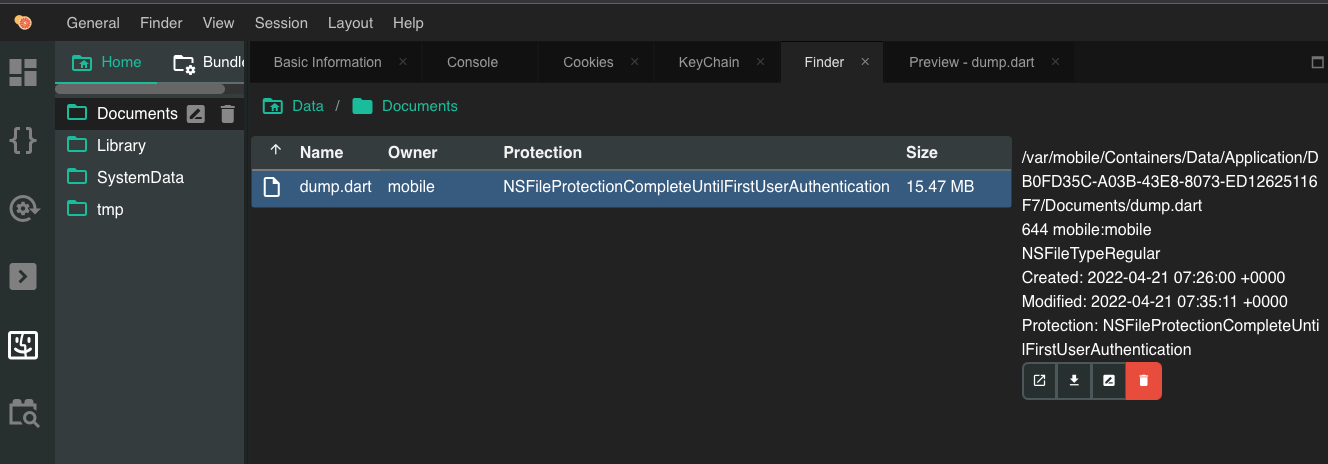
When you first run the patched app, reFlutter will create a dump.dart file within the Documents directory of the app’s local storage. We can extract that using a number of tools, in my case I used grapefruit and navigated to the folder.
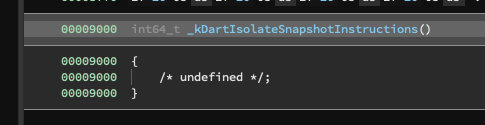
The dump.dart file contains a large array of classes, functions and fields as mentioned earlier. The structure of each item will indicate the name of the function (or object/field), and the code offset. For example the following snippet corresponds to the _sendLoginRequest function and indicates the code offset to be at ` _kDartIsolateSnapshotInstructions + 0x0000000000163cf4`:
Function '_sendLoginRequest@1891243549':. null {

               Code Offset: _kDartIsolateSnapshotInstructions + 0x0000000000163cf4

       }
What is _kDartIsolateSnapshotInstructions? I’m glad you asked, this is the Snapshot offset within the application libapp.so file. In this case the iOS binary had been combined into a single App file, so I opened that up in Binary Ninja and noted the address of _kDartIsolateSnapshotInstructions to be 0x9000.
We can now use this information inside the frida.js hooking template provided to hook this function.
var dumpOffset = '0x' +(0x9000 + 0x163cf4).toString(16)
When we load script and the application through Frida and send a sample login with the username test, we will see outputs like this:
$ frida -U -f "com.whisker.ios" -l frida.js --no-pause
Spawned `com.whisker.ios`. Resuming main thread!

[iPhone::com.whisker.ios]->
baseAddress: 0x1081d8000
codeOffset: 0x108344cf4

Wait.....

--------------------------------------------|

    Hook Function: 0x16ccf4

--------------------------------------------|

Argument 0 address 0x10bb6c451 buffer: 150
Argument 1 address 0x10aece851 buffer: 150
[...]
Argument 2 address 0x10c89bb81 buffer: 150

 Value:
00000000  02 4e 00 00 00 00 00 08 00 00 00 00 00 00 00 74  .N.............t
00000010  65 73 74 01 00 00 00 41 80 00 09 01 00 00 00 1a  est....A........
00000020  1b cb 0b 00 00 00 00 41 80 00 09 01 00 00 00 31  .......A.......1
00000030  47 b6 0b 01 00 00 00 41 80 00 09 01 00 00 00 11  G......A........
00000040  bb 8a 0c 01 00 00 00 11 04 1b 0a 01 00 00 00 41  ...............A
00000050  80 00 09 01 00 00 00 31 02 1b 0a 01 00 00 00 81  .......1........
00000060  bc 8a 0c 01 00 00 00 41 80 00 09 01 00 00 00 21  .......A.......!
00000070  40 1c 0a 01 00 00 00 41 80 00 09 01 00 00 00 41  @......A.......A
00000080  80 00 09 01 00 00 00 71 80 00 09 01 00 00 00 61  .......q.......a
00000090  da ba 08 01 00 00                                ......
We can see the string test has been dumped from the second argument in the function, cool! I hope this helped give an understanding of the depth you might end up with when having a look at a Flutter application, I’ll leave the rest of the Flutter fun to you and move on to the API.
For Mobile traffic inspection I am using Burp Suite, set-up for the interception proxy was simple and there are plenty of guides on getting started with Burp Suite so I will skip to the fun stuff.
The first thing I noticed in the traffic was a few requests to the GraphQL endpoint https://graphql.whisker.iothings.site/v1/graphql. Naturally I decided to do a quick introspection query to see if the schema was available. It was! And after plugging the result into GraphQL Voyager I had a nice overall view of the schema:
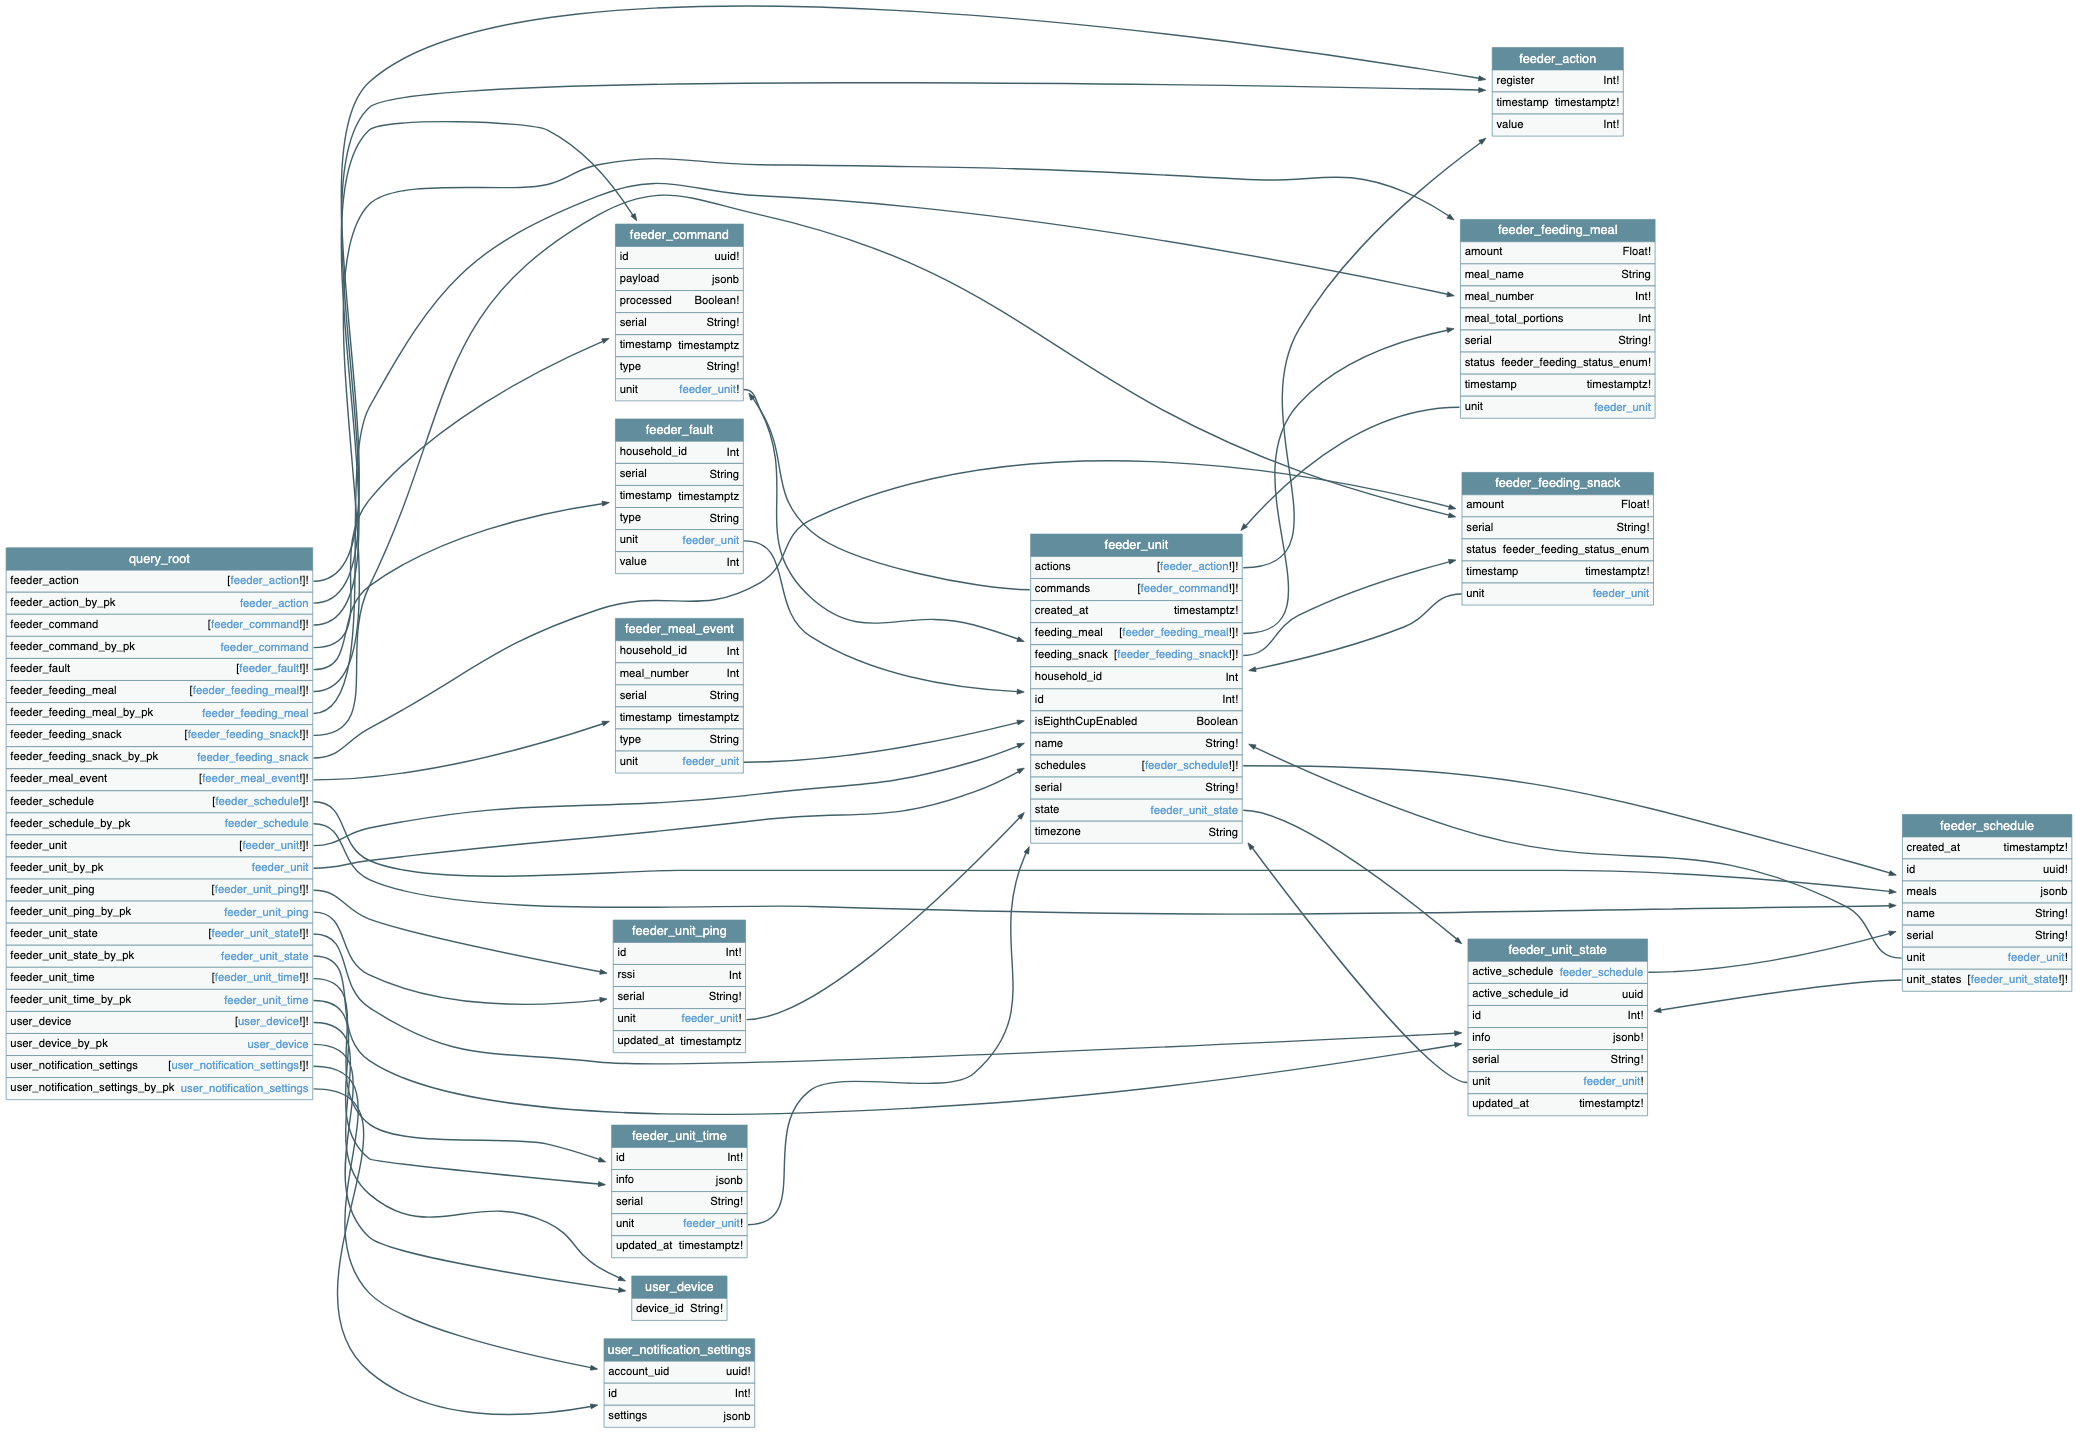
Yeah it’s not the best image to insert into a blog, but as far as GraphQL Schemas go, it’s pretty small. It also revealed pretty quickly that this GraphQL API was not intended for the Litter Robot, and only handled the user notifications portion of the mobile application.
Moving on, let’s take a look at the on-boarding flow and command dispatch, this is where everything started to come together and everything you have read so far might make a little more sense.
Register device
The first request made during on-boarding is to https://v2.api.whisker.iothings.site/users/1065769/robots, the payload structure looks like this:
{
    "litterRobotSerial": "LR3MEOW",
    "litterRobotNickname": "Litter-Robot",
    "type": "lr"
}
And here is where it gets interesting, this is what we see in the response:
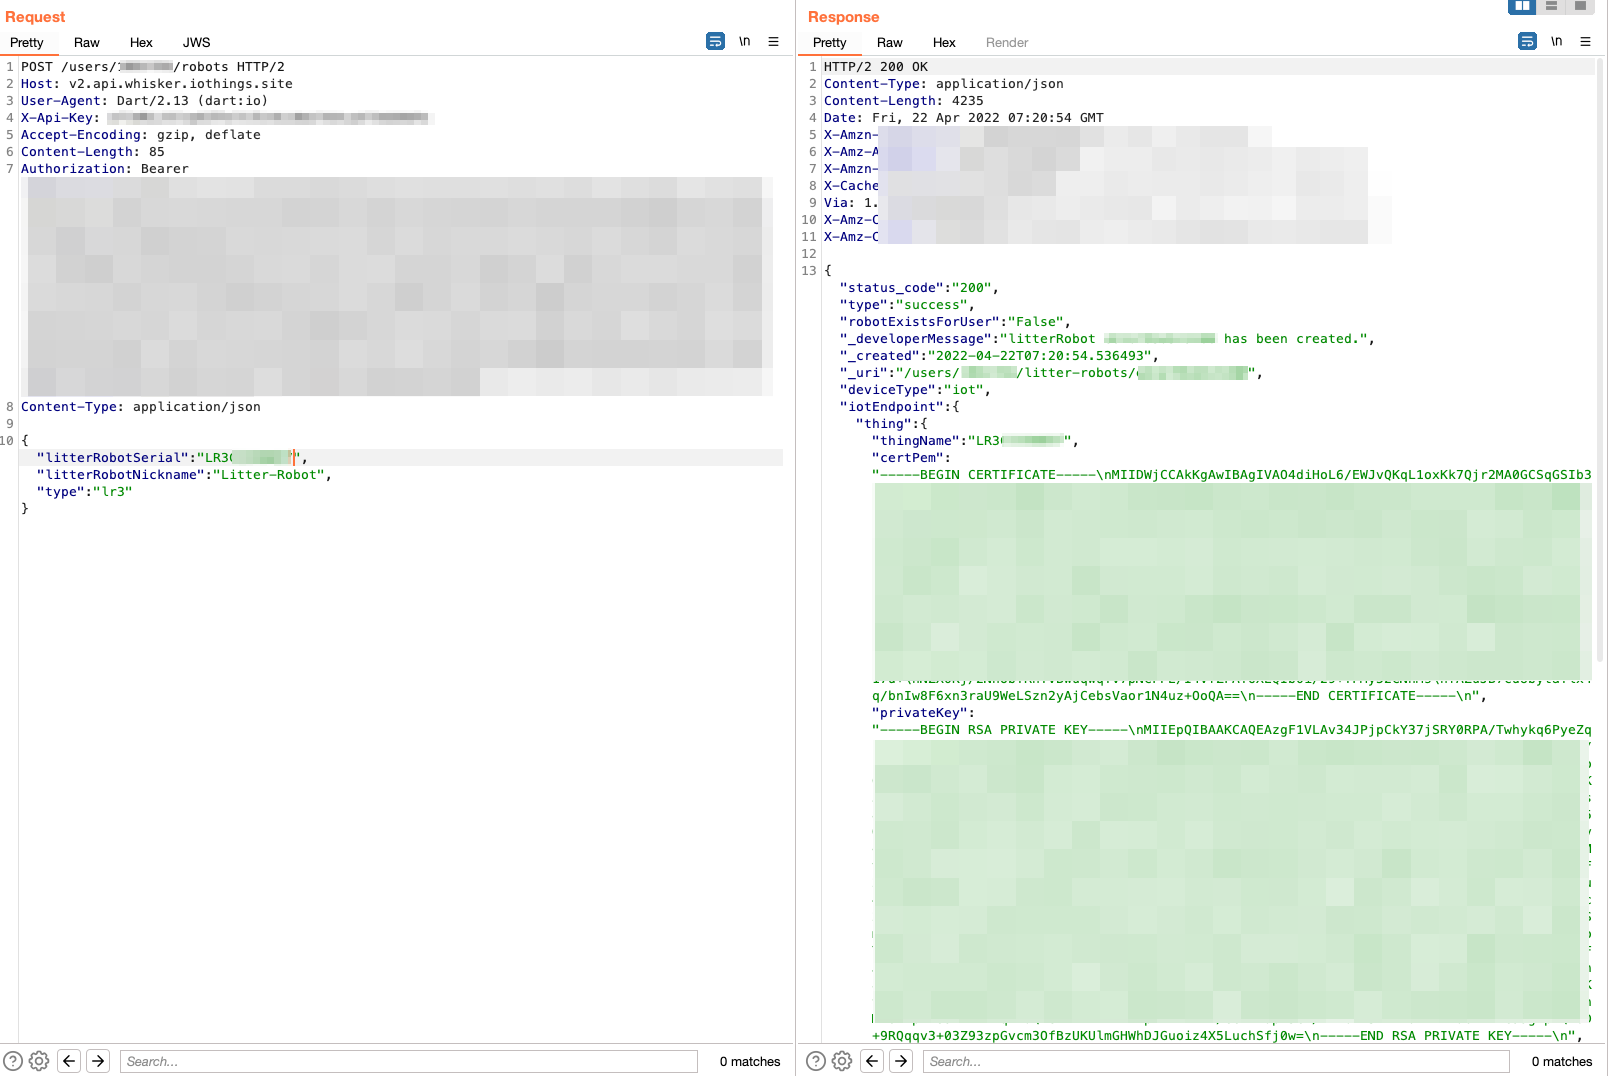
That’s right! It’s the certificate pair and URL that we saw in the UDP packets sent to the device during on-boarding. We can now piece the puzzle together, these are part of the AWS IoT Core framework. A quick look into the setup guide shows that when a new device is registered, a certificate pair is created and must be used with the device/API in order to communicate with AWS IoT Core.
So that’s what is happening in our on-boarding process, the device is being registered in the Litter Robot instance of AWS IoT Core, and then the paired certificates along with the correct endpoints for the user and device ID are stored on the device’s config partition on the flash memory.
Thank you for making it this far! When I took on this project I had a few goals in mind, and I completely lost myself in all the different aspects that were involved, spending time on each part became addictive and a lot of time was simply lost in a wave of browser tabs, red bull and error messages or unreadable byte code. I hope you learnt something, or are inspired to take this further.
RE of LR3
March 2025 - New Method to Leverage Unsafe Reflection and Deserialisation to RCE on Rails
October 2024 - A Monocle on Chronicles
August 2024 - DUCTF 2024 ESPecially Secure Boot Writeup
July 2024 - plORMbing your Prisma ORM with Time-based Attacks
June 2024 - plORMbing your Django ORM
January 2024 - Keeping up with the Pwnses
elttam is a globally recognised, independent information security company, renowned for our advanced technical security assessments.
Read more about our services at elttam.com
Connect with us on LinkedIn
Follow us at @elttam
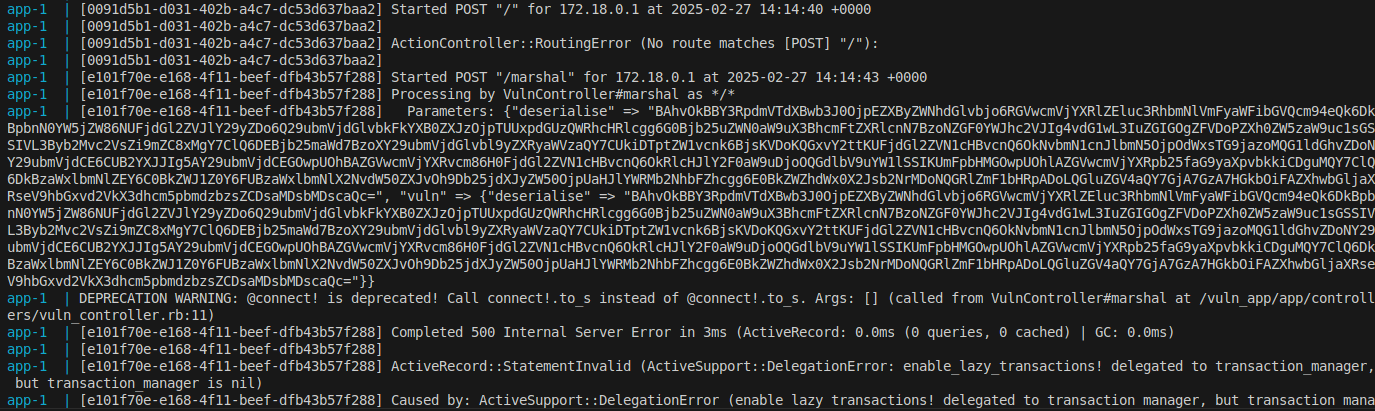 New Method to Leverage Unsafe Reflection and Deserialisation to RCE on Rails
By Alex Brown March 04, 2025
This blog article documents a new unsafe reflection gadget in the sqlite3 gem, that can also be used in a deserialisation gadget chain to achieve RCE and is installed by default in new Rails applications.
 A Monocle on Chronicles
By Matt October 02, 2024
This post provides an overview of Talkback Chronicles for viewing snapshots of trending infosec resources for points in time, and also how to subscribe to a new weekly Newsletter feature.
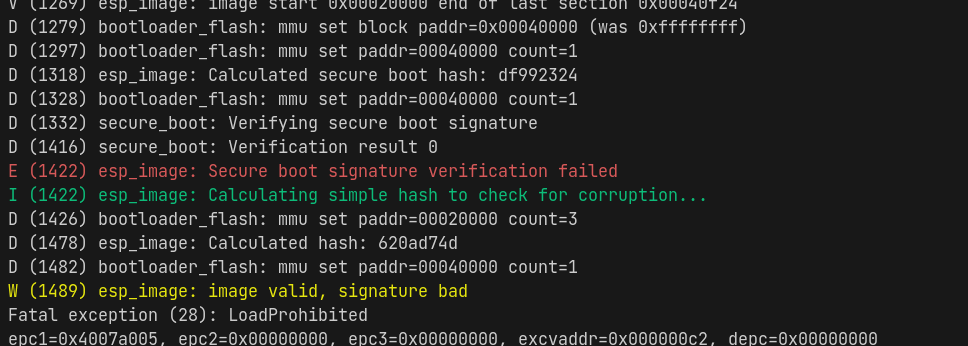 DUCTF 2024 ESPecially Secure Boot Writeup
By daniel August 01, 2024
This blog post covers a DUCTF 2024 pwn challenge called "ESPecially Secure Boot", which required writing an exploit for CVE-2018-18558.